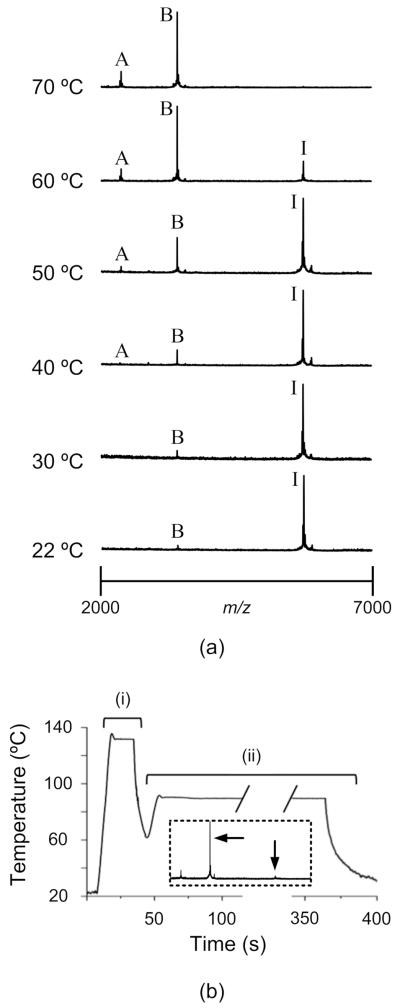
Figure 3.
(a) MALDI-MS spectra for insulin samples on heaters for 180 s at temperatures from 22 °C to 70 °C. The intact insulin signal is labeled “I” (m/z ≈ 5720), the A-chain is labeled “A” (m/z ≈ 2460), and B-chain is labeled “B” (m/z ≈ 3420). Each spectrum represents the average of 100 to 200 laser shots, taken from three different target spots. At 22 °C and 30 °C, A-chain signals could not be distinguished from noise. (b) A typical heater time history for high-temperature insulin disulfide reduction (i) and matrix crystallization (ii) in DMSO. The inset spectrum, in which arrows denote B-chain and intact insulin signals, indicates that the reduction is nearly complete after heating for 30 s.

