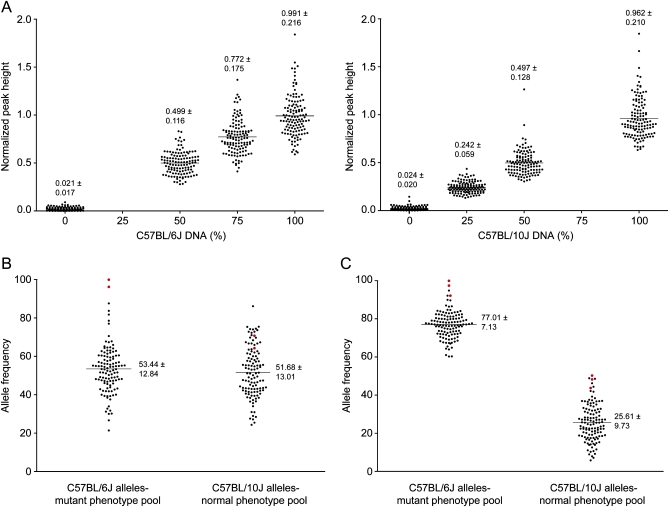
Figure 2.—
Estimated C57BL/6J and C57BL/10J allele frequencies in june gloom and mayday circler mutant and normal phenotype pools at 124 SNP sites. (A) Normalized peak heights, calculated as described in materials and methods, for each of 124 markers in samples with known ratios of C57BL/6J:C57BL/10 genomic DNA. For each individual marker, a standard curve was generated and fitted to a line by linear regression. Values, mean ± SD; lines represent mean. (B and C) C57BL/6J and C57BL/10J allele frequencies at each of 124 markers in the mutant and normal phenotype DNA pools, respectively. Shown in red are data points representing the marker with the highest linkage score and those flanking it. Values, mean ± SD; lines represent mean. june gloom samples (B) and mayday circler samples (C) are shown.

