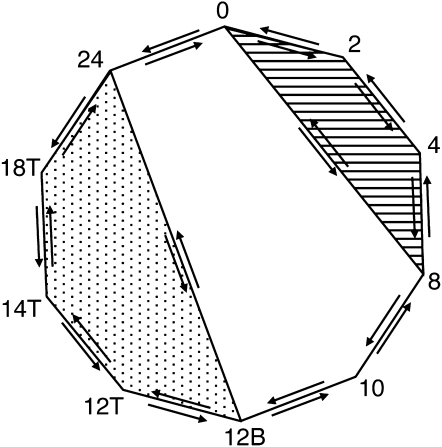
Figure 2.—
Microarray experimental design for N. crassa conidiation time course. Each arrow represents one hybridization, with arrows pointing in opposite orientations indicating dye swap experiments. The striped area represents comparisons of the earlier time points only; the dappled area represents comparisons of late time points only.

