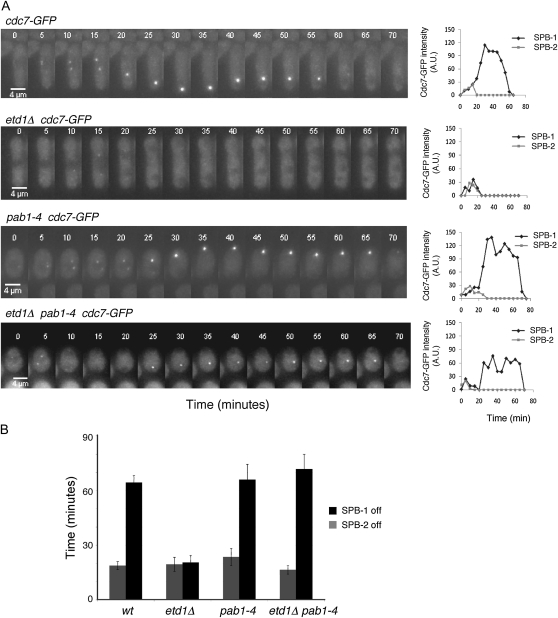
Figure 3.—
Effects of pab1-4 in Spg1 activity. (A) Cdc7-GFP was imaged by time-lapse microscopy at 5-min intervals on a single focal plane in living wild-type cells and in etd1Δ, pab1-4, and etd1Δ pab1-4 mutant cells as indicated. Fluorescence intensity was quantified (arbitrary units) and represented for each SPB (SPB-1 and SPB-2). Bar, 4 μm. (B) Average of the time that SPBs remained active. Time (minutes) from initial SPB activation until the SPB was switched off was determined for each SPB (SPB-1 and SPB-2) in 10 cells per strain. Error bars represent standard deviations.

