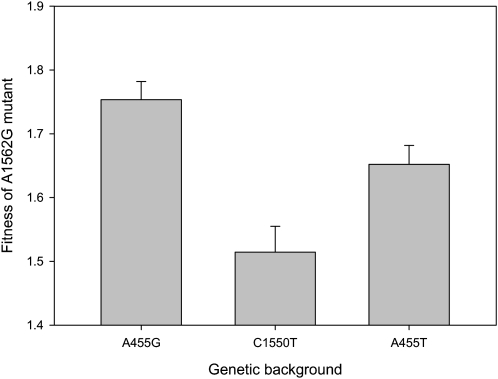
Figure 3.—
Complex epistatic effects of mutation A1562G. This figure shows the mean (±SEM) fitness effect of the A1562G mutation across genetic backgrounds. The A1562G mutation has a different effect on fitness in each genetic background, as determined by a one-way ANOVA (F2,136 = 10.5, P < 0.0001) followed by a Tukey test (P < 0.05).

