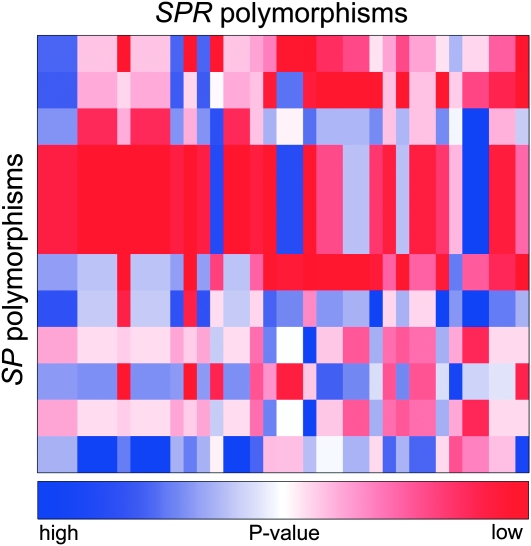
Figure 4.—
SP × SPR polymorphism interactions in P1. Polymorphisms in SP interact with polymorphisms in SPR to give the final P1 score of each genotypic pair. Male SP polymorphisms are represented by rows and female SPR polymorphisms are represented by columns. Several SP polymorphisms are in linkage disequilibrium and several SPR polymorphisms are in linkage disequilibrium, reducing the total number of interactions possible. Colors represent the uncorrected P-value of each interaction. Dark blue represents higher P-value, less significant interactions. Dark red represents lower P-value, more significant interactions. Significance was tested by a log-linear model.

