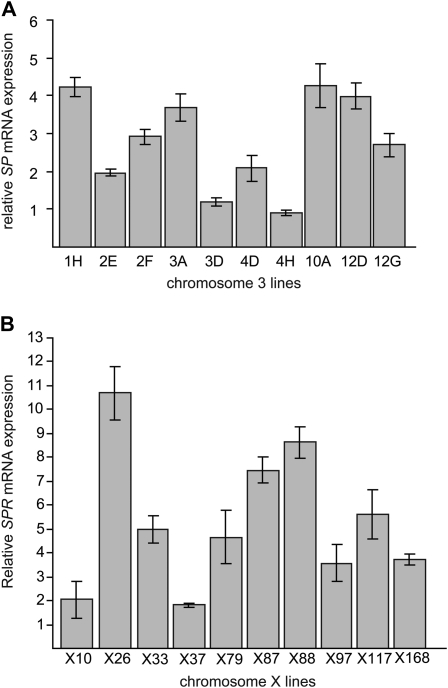
Figure 6.—
SP and SPR mRNA expression varies across lines. mRNA expression was quantified by qPCR. (A) SP expression in male third chromosome extraction lines significantly differs (P < 2.2 × 10⁻¹⁶). (B) SPR expression in female X chromosome extraction lines significantly differs (P < 2.2 × 10⁻¹⁶). Levels of mRNA are expressed relative to a standard Canton-S laboratory strain. All measurements consist of six measurements, two biological replicates containing three technical replicates each. Mean ± SD is shown.

