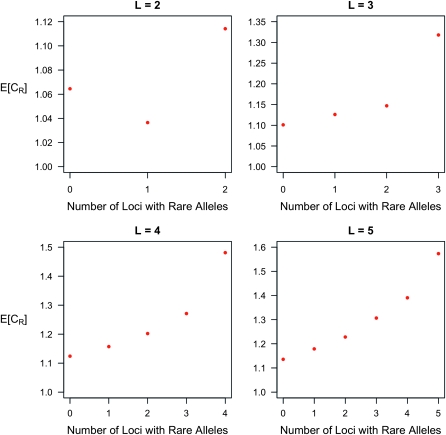
Figure 2.—
Expected increase in the interaction ratio as a function of the number of loci with rare causative alleles, given the total number of loci is L. Except for the case of L = 2, when there are both rare and common alleles, the increase in average CR increases with the proportion of rare alleles. The same parameter values as in Figure 1 are assumed here. In particular, rare risk alleles are assumed to have frequency p = 0.03, while common risk alleles are assumed to have frequency p = 0.25.

