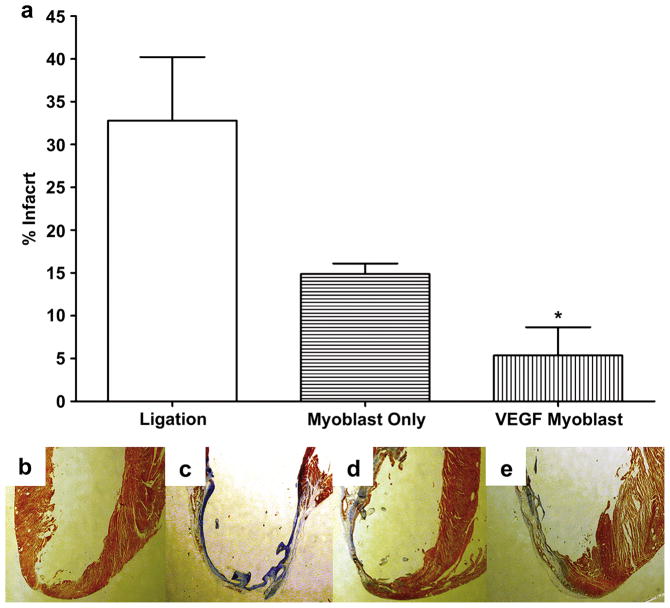
Figure 3.
Masson’s trichrome staining for infarct size, four weeks after surgery. (a) Infarcted area as a percentage of the left ventricle. P<0.05 for ligation only versus VEGF myoblast group (b–e) Representative myocardial tissue sections stained with Masson’s trichrome. Bluish staining indicates high collagen content, indicating infarction; (b) Thoracotomy only, control group, (c) ligation only, (d) untransfected myoblast injection group, (e) VEGF165- transfected myoblast injection group. All data are presented as mean ± SEM (n=5 thoracotomy, n=7 ligation, n=7 myoblast only, and n=7 VEGF myoblast group).

