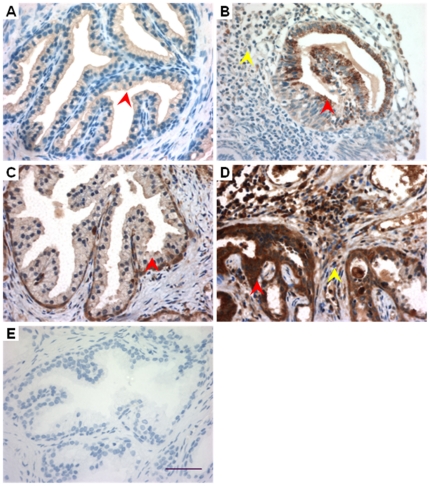
Figure 9. Expression of CFTR and CAII in human hyperplasia prostate with inflammation.
CFTR (A, B) and CAII (C, D) were detected in human hyperplasia tissues. There was lymphocytes infiltration (Yellow arrow, B, D) in the inflamed area of the clinical prostate hyperplasia samples. Note that the expression of CFTR and CAII was stronger in the area with lymphocytes infiltration (Red arrow, B, D) than those without infiltration (Red arrow, A, C). (E) Negative control. Scale bar: 50 µm.

