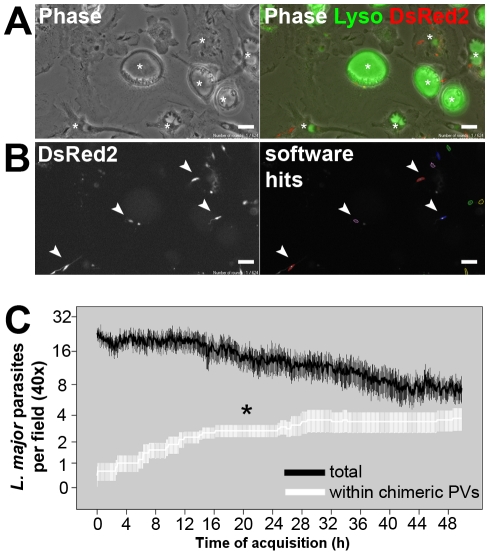
Figure 3. Algorithm-based recognition of L. major-DsRed2 parasites hosted by superinfected macrophages.
(A) Example of an acquired field of macrophages infected for 48 hours with L. amazonensis and superinfected with L. major-DsRed2 metacyclic-enriched promastigotes. First picture is a phase contrast image (Ph2) acquired at 40x magnification, and second is the phase contrast image merged with RG fluorescence channels; Lysotracker in green, L. major-DsRed2 in red. Leishmania amazonensis PVs are indicated by asterisks. (B) Parasite recognition and quantification by Acapella software. The raw data (DsRed2 fluorescence) are shown in the first image and a quantified image is presented in the second (circles represent quantification hits). Examples of parasites recognized by the software are indicated by arrowheads. Bars = 10 µm. (C) Total number of L. major-DsRed2 parasites quantified by software algorithms (black line) and L. major-DsRed2 found within chimeric PVs (white line) quantified by time-lapse videomicrography observation. Acquisition started 2 hours after promastigote addition. Each line represents the mean quantification of 7 microscopic fields (40 x), at logarithmic (base 2) scale, plotted with s.e.m. The total number of promastigotes hosted by superinfected macrophages decreased after approximately 20 hours of experiment. There is a significant increase in the number of L. major parasites found within chimeric PVs in the first 12–20 hours of acquisition (One-way ANOVA with Tamhane's T2, Dunnett's T3 and Games-Howell Post Hoc multiple comparison tests between hourly time points, p<0.05).

