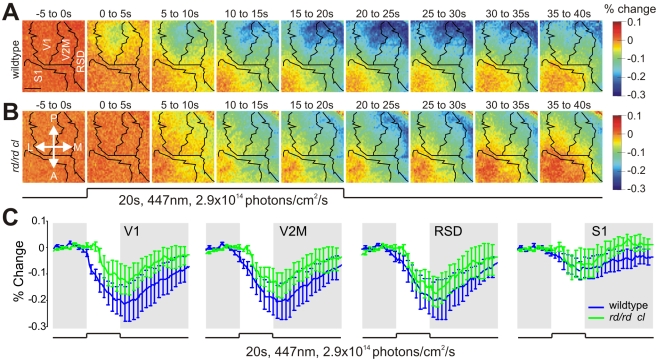
Figure 3. Melanopsin activates the visual cortex.
(A,B) Average pseudo-colored maps of cortical activity in response to 20 s light stimulation in the rd/rd cl and wildtype mice (both n = 4). Green/blue areas on map indicate a decrease in the optical imaging signal, corresponding to neuronal activation. Scale bar represents 1 mm. P, Posterior; M, Medial; A, Anterior; L, Lateral. (C) Time course of the optical imaging signal at different cortical regions (mean ± SEM) in rd/rd cl and wildtype mice. At all but the earliest timepoints the light response rd/rd cl mice accounted for a large proportion of the wildtype response. RSD, retrosplenial dysgranular cortex; S1, somatosensory area 1; V1, visual area 1; V2M, visual area 2 medial.

