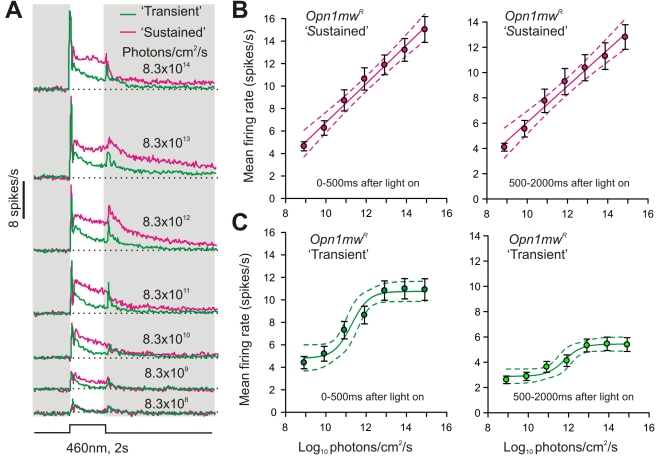
Figure 6. Irradiance coding by “sustained” lateral geniculate neurons.
(A) Mean response of “transient” and “sustained” Opn1mwR LGN neurons (n = 134 and 114, respectively) to 2 s blue light pulses. (B,C) Quantification of the firing rate of Opn1mwR “sustained” (B) and “transient” (C) LGN cells during the first 500 ms (left) or remainder (500–2000 ms; right) of the light pulse. Symbols indicate mean (± SEM), and lines indicate mean (±95% CI) of the function that best described the data. Note the linear relationship between firing rate and log irradiance across the full range tested for Opn1mwR “sustained” cells in contrast to the sigmoidal relationship saturating above 1012 photons/cm2/s for Opn1mwR “transient” responses.

