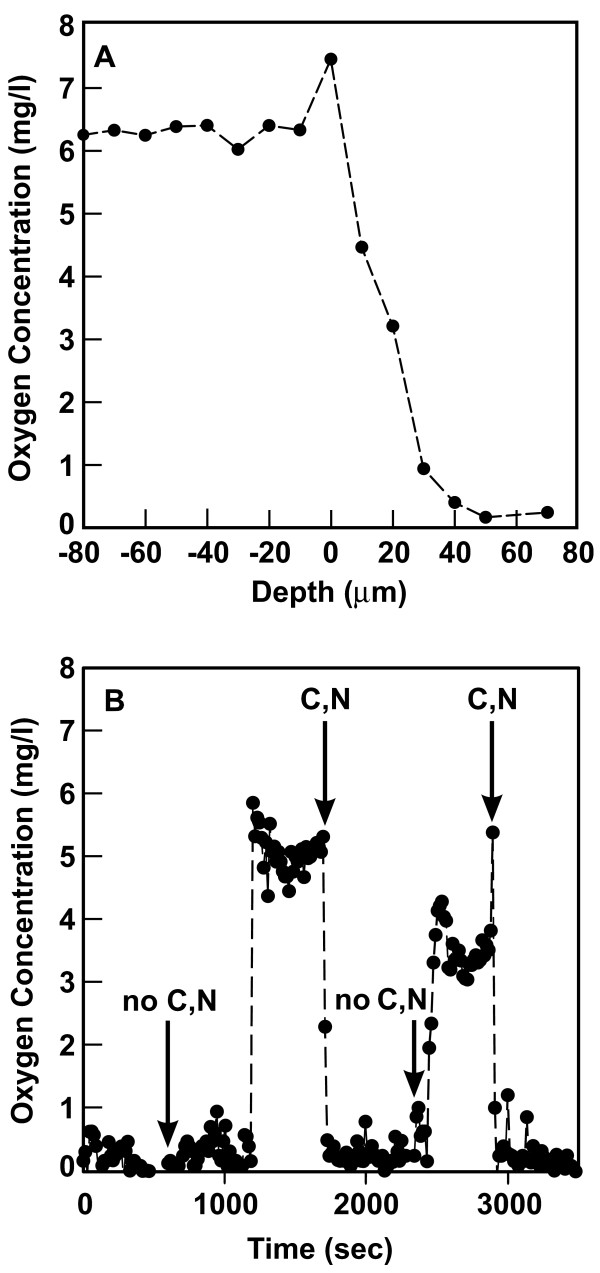
Figure 1.
Oxygen concentrations in Pseudomonas aeruginosa biofilms. Panel A shows a representative oxygen concentration profile with depth in the biofilm. Zero on the x-axis corresponds to the biofilm-bulk fluid interface. Negative positions are located in the fluid film above the biofilm and positive positions are located inside the biomass. Panel B shows the coupling between oxygen and glucose utilization. The oxygen microelectrode was positioned at a location within the biofilm where the oxygen concentration was low. The medium flowing over the biofilm was switched between one containing glucose and ammonium ion (C, N) and a medium lacking these constituents (no C, N) as indicated by the arrows. The complete medium is present at time zero.

