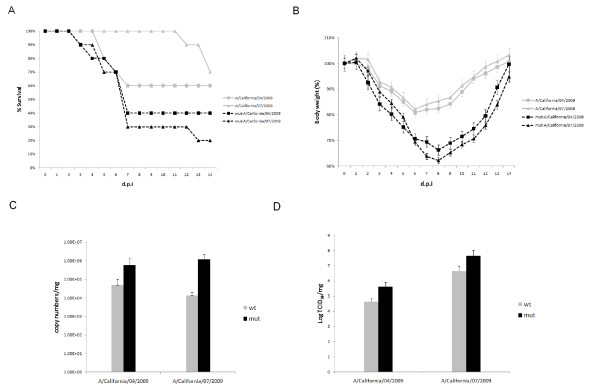
Figure 2.
Virulence comparison of the wild type and mutated A/California/04/2009 and A/California/07/2009 viruses in BALB/c mice. (A) Survival percentage of mice intranasally challenged with each virus with 106 TCID50 in a volume of 50 μl. (B) Body weight changes of infected mice. Mean body weight and standard deviation were calculated as percentage of body weight compared to those at 0 d.p.i. (C) The viral RNA loads of viruses in lung tissues of mice which euthanized at 5 d.p.i.. Data represented the mean viral RNA load per microgram of lung tissues ± standard deviation. (D) The viral titers in lung tissues of mice which euthanized at 5 d.p.i.. Data represented the mean log TCID50 per microgram of lung tissues.

