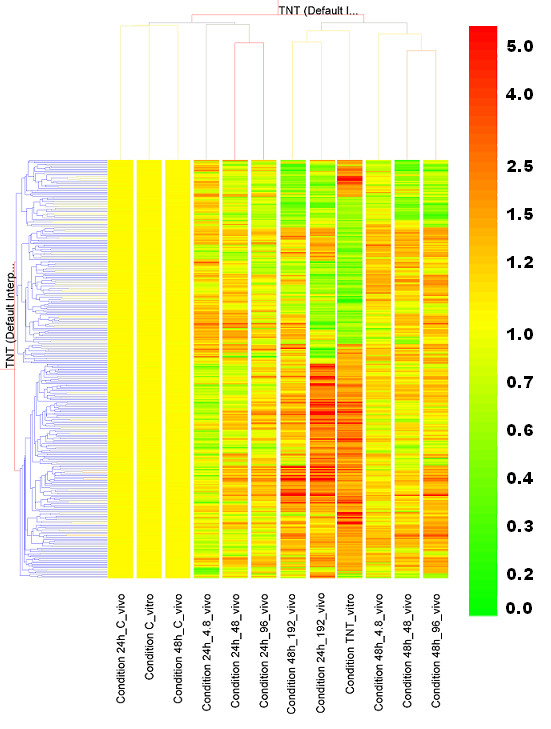
Figure 2.

Hierarchical clustering of experimental conditions. Experimental conditions were based on averaging samples with the same treatments or controls of both in vitro and in vivo experiments. Total 12 experimental conditions including 10 in vivo and 2 in vitro were put together for a Two-Way hierarchical clustering. 341 common transcripts (horizontal axis) were used for clustering across all the conditions (vertical axis). A Pearson correlation algorithm was applied to calculate the distances between transcripts or between conditions. The relative level of gene expression is indicated by the color scale at the right side.
