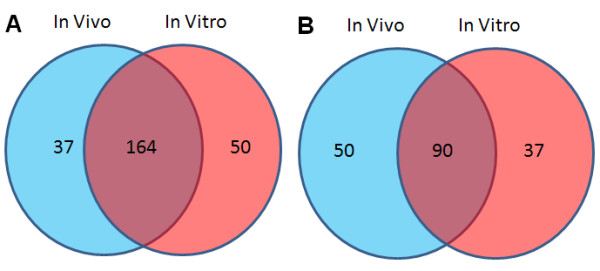
Figure 3.

Comparison of upregulated and downregulated transcripts between in vivo and in vitro TNT treatments. Among 341 commonly regulated transcripts regulated by TNT in vitro and in vivo, commonly upregulated transcripts (A) and downregulated transcripts(B) of these 341 transcripts between in vivo TNT treatment at 199 mg/ml for 24 h and in vitro TNT treatment are shown by the Venn diagram.
