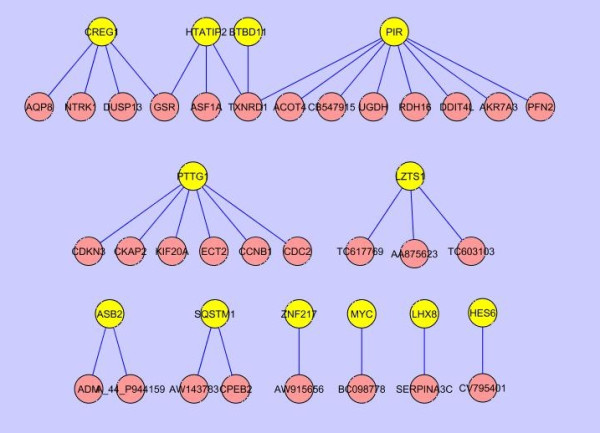
Figure 7.

Conserved sub gene networks between in vitro and in vivo gene networks. By comparing in vivo and in vitro gene networks (shown in Fig. 6), conserved subnetworks that had the same connections in the both networks were achieved. Transcription factors are highlighted as yellow.
