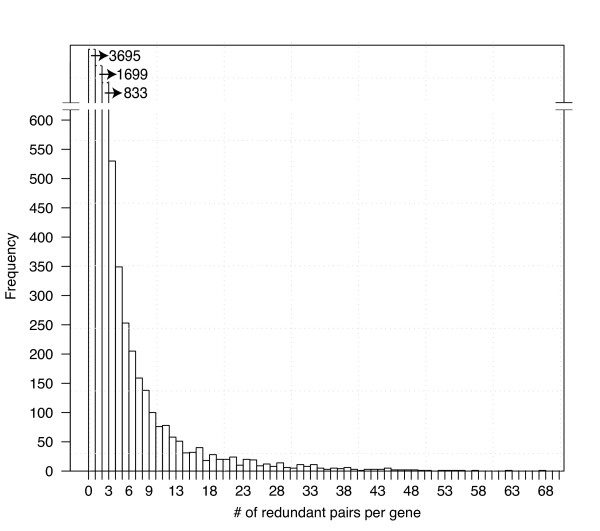
Figure 2.
The predicted depth of redundancy genome-wide. Genes are grouped into bins based on the number of paralogs with which they are predicted to be redundant. The first bin represents the number of genes that were predicted to have exactly one redundant paralog, using the cutoff of 0.4. The frequency distribution shows that most genes have relatively few predicted redundant duplicates.

