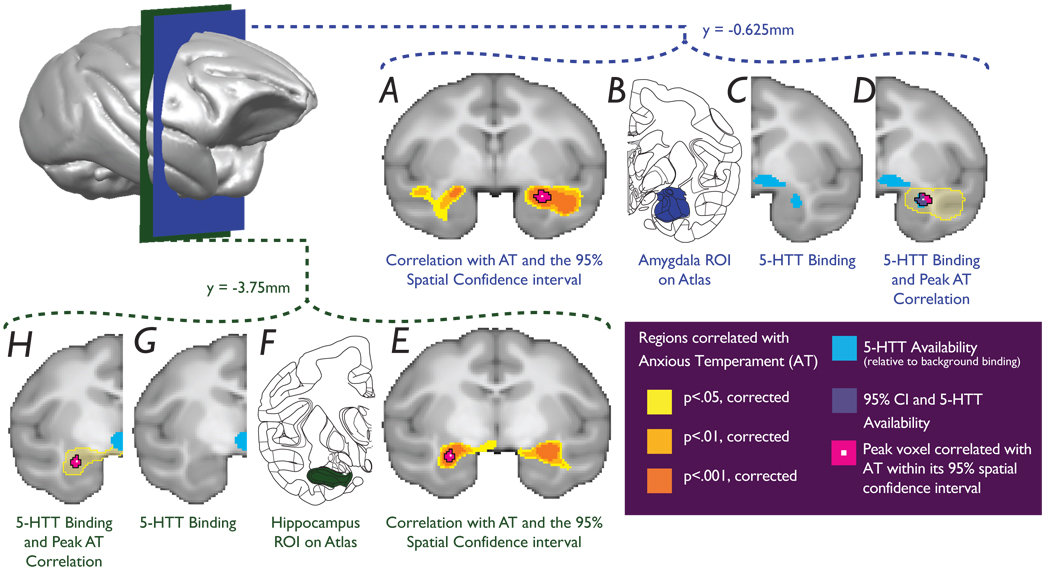
Figure 1. Glucose metabolism in the anterior temporal lobes is predictive of AT.
a, amygdala and e, hippocampus (significance of correlations - yellow: p < 0.05, light orange: p < 0.01, dark orange: p < 0.001, corrected). Pink areas represent 95% spatial confidence intervals of the peak correlations. b and f, corresponding slices adapted from The Rhesus Monkey Brain in Stereotaxic Coordinates (2009). c, g, 5-HTT binding differentiates the CeA region from the anterior hippocampus. d, The CeA, defined by the 5-HTT map, encompasses the amygdala peak. h, The hippocampal peak is distinct and does not overlap with the 5-HTT map.

