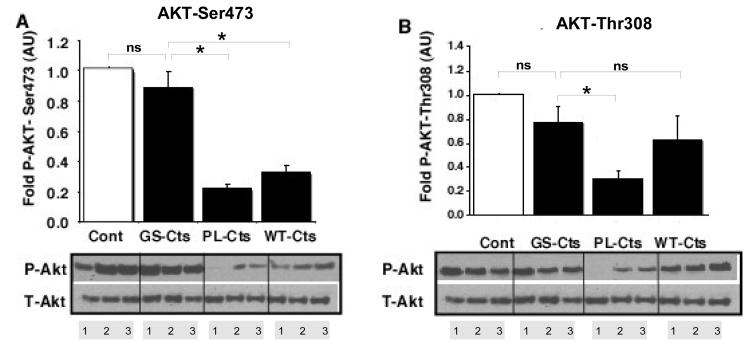
Figure 4. Effects of Cts variants on Akt phosphorylation after I/R.
The phosphorylation status of A) Akt-Ser473 and B) Akt-Thr308 were normalized to total Akt. Densitometric scans are represented in arbitrary units (AU) relative to the control (Cont = 1). The bars represent mean ± SEM of 3 hearts (lanes 1,2 and 3). *p≤ 0.05 for differences between PL-Cts and WT-Cts versus GS-Cts.

