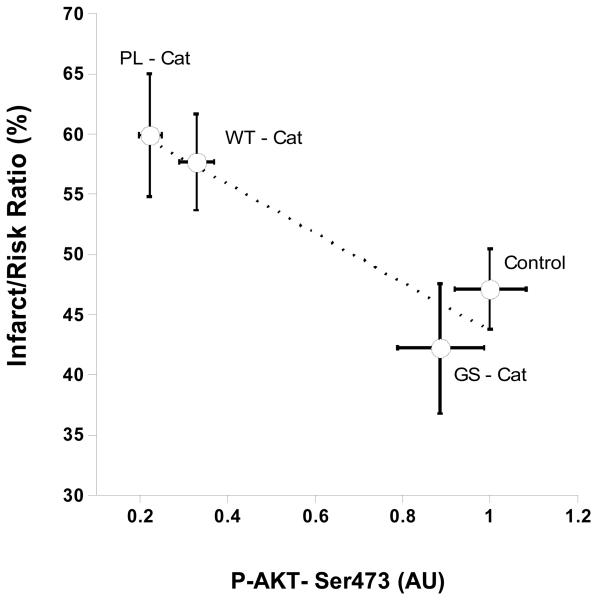
Figure 7. Correlation between infarct size (%) and Akt-Ser473 phosphorylation.
A 2-D plot was constructed using the Kalidograph® programme for the data for AktSer473 phosphorylation (Fig.4) versus the % infarct size (Fig.3). The correlation value (r2=0.877) indicates that the infarct size is inversely correlated with Akt-Ser473 phosphorylation for the Cts peptides examined.

