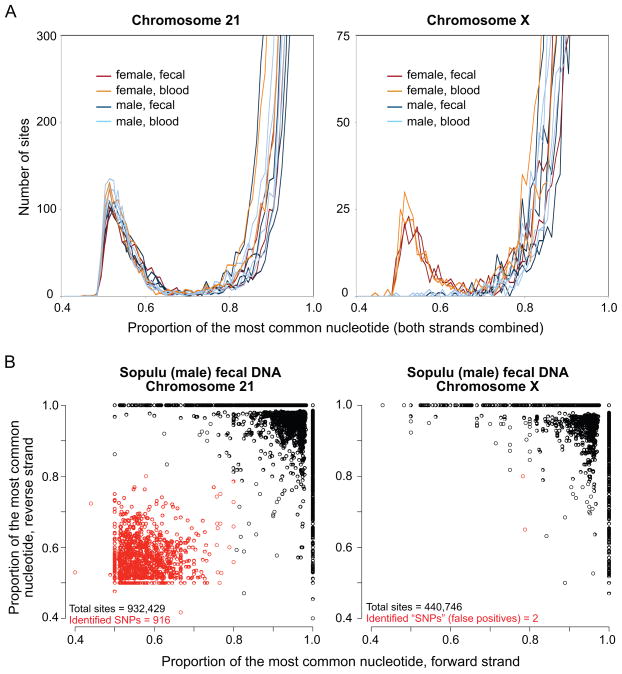
Fig. 1. Data quality and SNP identification.
(A) Frequency distributions of the proportion of the most common nucleotide at each targeted site that has filtered read coverage sufficient for SNP identification (≥ 20 total reads with at least 10 from each strand; proportion bins = 0.01) for each sample, separately by chromosome. For the overwhelming majority of sites, the most common nucleotide proportion equals 1 (the Y axis is cut off). There is a dearth of sites with intermediate-proportion nucleotides on the X chromosome in male samples. (B) Plots of the most common nucleotide proportion by mapped strand, for each site with filtered read coverage ≥ 10 on each strand for one selected sample (Sopulu, fecal DNA), separately by chromosome. Heterozygous sites were identified as those with most common nucleotide proportion ≤ 0.8 on both strands (red circles). For the overwhelming majority of sites, the most common nucleotide proportions equal 1 on both strands: 868,450 of 934,229 sites (93%) on chromosome 21, and 413,224 of 440,746 sites (94%) on chromosome X.

