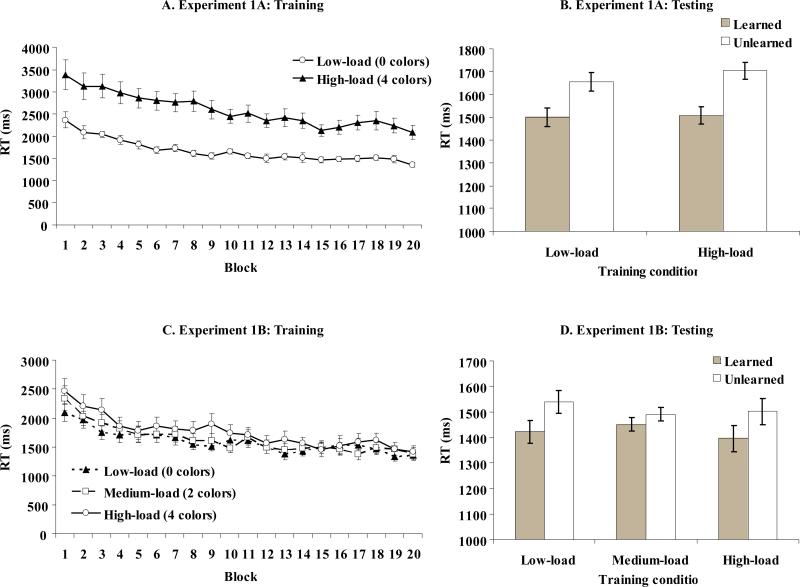
Figure 2.
a.) Mean RT results from training phase of Experiment 1A (error bars represent SEM in training graphs). b.) Mean RT results from the testing phase of experiment 1A (error bars represent standard error of the difference between learned and unlearned in testing graphs). c.) Mean RT results from the training phase of Experiment 1B. d.) Mean RT results from the testing phase of Experiment 1B.

