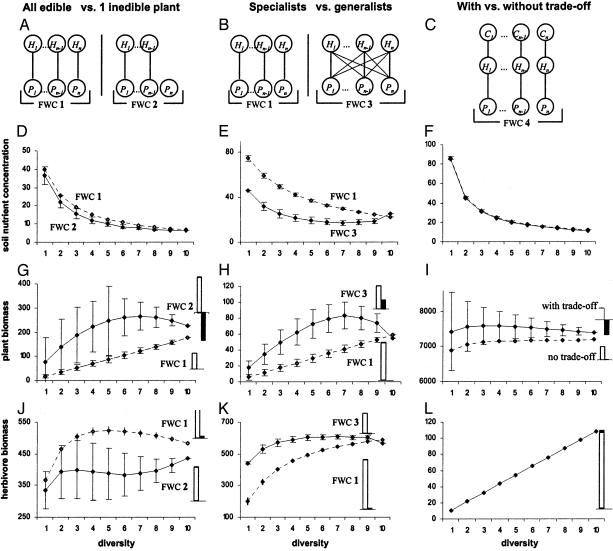
Fig. 1.
Expected soil-nutrient concentration, total plant biomass, and total herbivore biomass as functions of plant species richness for different food-web configurations (mean ± 1 SD) when the soil-nutrient pool is quasihomogeneous (i.e., the nutrient transport rate k is high). Herbivore species richness varies parallel to plant species richness to keep the same food-web configuration along the diversity gradient. Top grafts show the food-web configurations (FWC) analyzed in the corresponding column. Pi, Hi, and Ci denote plant, herbivore, and carnivore species i, respectively. (Left) Comparison between FWC 1 with no inedible plant (dotted line) and FWC 2 with one inedible plant (solid line). (Center) Comparison between FWC 1 with specialist herbivores (dotted line) and FWC 3 with generalist herbivores (solid line). (Right) Comparison between an ecosystem with a trade-off between plant competitive ability and plant resistance to herbivory (solid line) and an ecosystem without this trade-off (dotted line) for FWC 4. Small histograms on the right show the strengths of the complementarity effect (open) and the selection effect (filled) for the highest-diversity treatment (10 plant species). These effects are measured on the same scale as the y axis, except for G where these effects are shown after a reduction by a factor 4. Parameter values are identical in all parts of the figure, except for k, I, bij, and qij: ai = 0.05i, lH = lN = 0.02, lR = 0.05, m = d = 0.3, and V = VR = 1. (Left) k = 100, I = 4.3, bi = 0.005i.(Center) k = 100, I = 22; for food-web configuration 3 (generalist herbivores), bii = 0.005i, bji = 0.005i + 0.001, if j > i and bji = 0.001 if j > i, in the specialist case, bi is identical with the total consumption rate of each herbivore in the generalist case. (Right) k = 50, I = 87; bi = 0.005i with trade-off, and bi = 0.0275 without trade-off.

