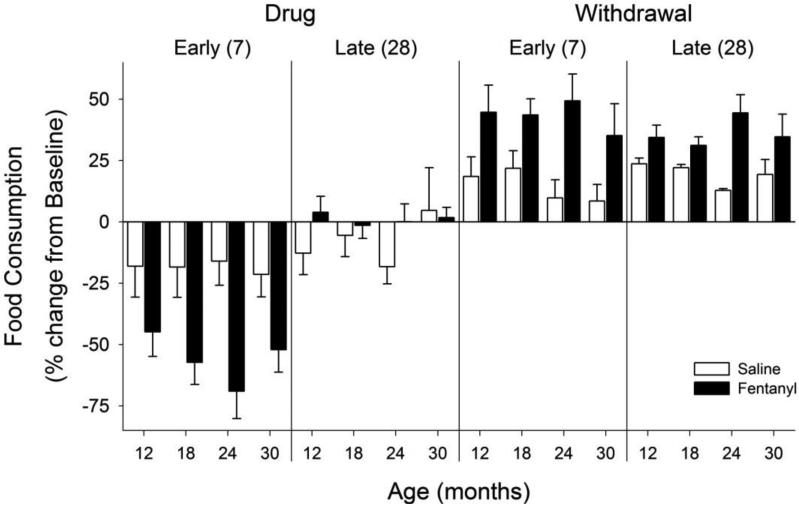
Figure 2. Food consumption.
Changes in food consumption during fentanyl/saline administration (“Drug”) and “Withdrawal”. Each phase is divided into an “Early” and “Late” stage, and the number in parentheses represents the number of days following the minipump implantation or removal that the measure was taken. Data are presented as percent change from baseline (mean ± SEM) for each age group. Note that fentanyl decreased food consumption across ages during early assessments, and increased food consumption throughout withdrawal.

