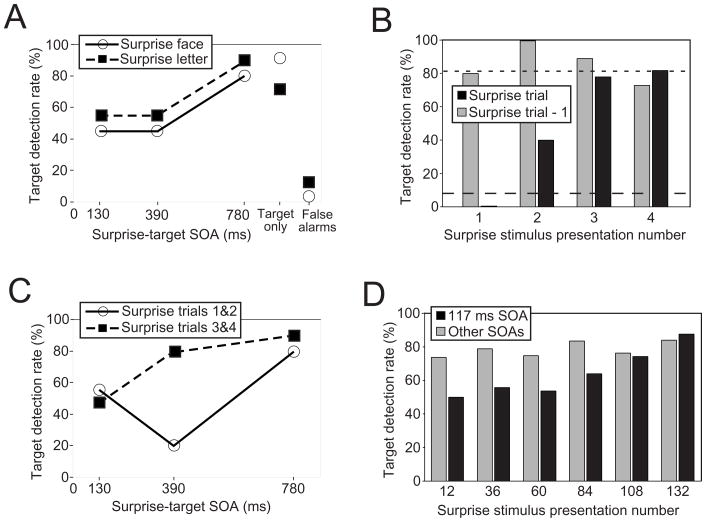
Figure 2.
Results for Experiments 1 and 2. (A) Effect of Surprise stimulus-to-Target SOA on the proportion (%) of participants with correct target detection in the first block of Experiment 1. Results are collapsed across the four Surprise stimulus presentations and shown separately for the Surprise face/Target letter and Surprise letter/Target face experimental groups. (B) Effect of Surprise stimulus presentation number on group target detection performance at the 390 ms Surprise stimulus-to-Target SOA in the first block of Experiment 1. Data are combined across the two experimental groups. Black bars represent performance for Surprise trials; gray bars represent trials immediately preceding Surprise trials. Dotted line indicates Target-only trial performance, while dashed line indicates false alarm rate. (C) Effect of SOA across Surprise stimulus presentation number in the first block of Experiment 1. Data are combined across the two experimental groups. (D) Group target detection performance by block in Experiment 2, plotted as a function of the number of Surprise stimuli that had been observed midway through each block (24 SS per block). “Other SOAs” includes all SS presentations at an SOA other than 117 ms and trials with a target but no SS.

