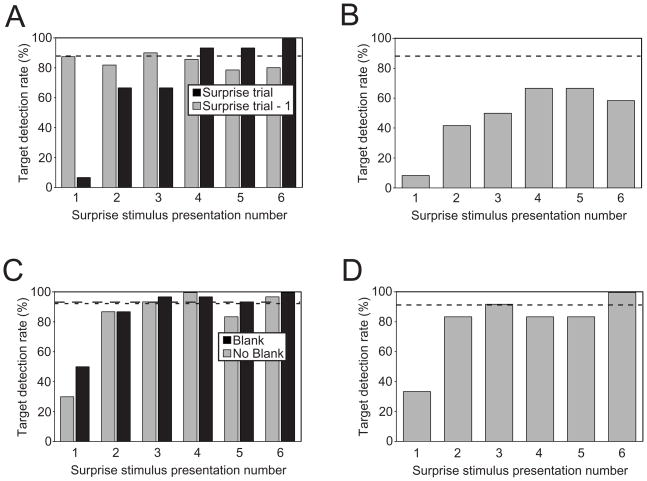
Figure 3.
(A) Group target detection performance in Experiment 4. Broken line corresponds to the average target hit rate in Target-only trials. (B) Group target detection performance in Experiment 5. (C) Group target detection performance in Experiment 6. Black bars represent participants’ performance for task with no blank interval following the Surprise stimuli; gray bars represent participants’ performance for task with a 130 ms blank interval following each Surprise stimulus. Dashed and dotted lines correspond to the average target hit rate for Target-only trials in the No-Blank and Blank tasks, respectively. (D) Group target performance in Experiment 7.

