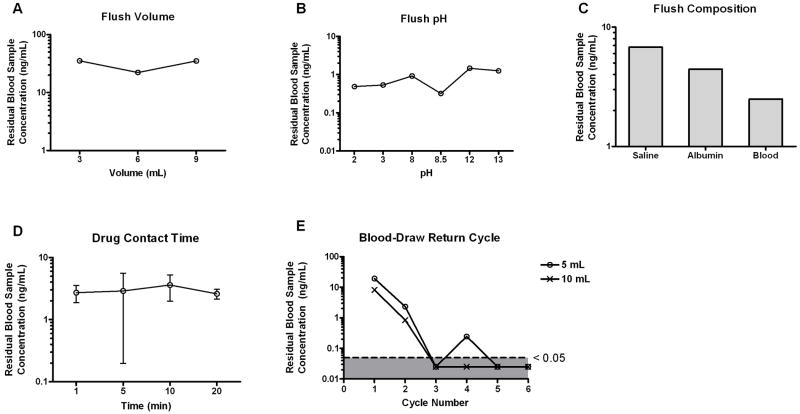
Figure 4.
Effect of clearing conditions on residual VCR concentration. Following the dosing of VCR, the catheter fragment was flushed with (A) varying volumes of normal saline; (B) normal saline with varying pH values; (C) normal saline followed by a second flush of varying compositions; (D) normal saline preceded by varying drug contact time in the catheter lumen. (E) 3 mL 0.9% normal saline flush followed by 5 or 10 mL of blood draw return cycles. Results are plotted as means or means ± SD from 2 or 3 independent experiments, respectively.

