
Figure 3.
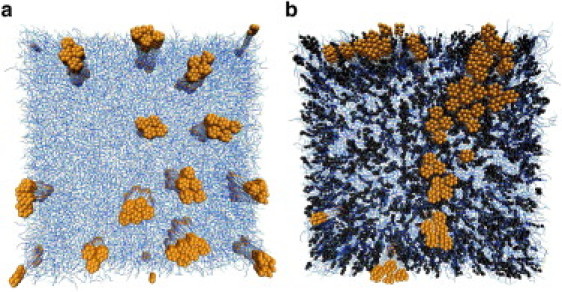
Snapshot of a top view of a lipid bilayer after 106 MC-DPD cycles. The lipids are depicted in blue, cholesterol in black. The proteins, in orange, have a small diameter of 13.5 Å and a positive mismatch of 3.5 Å in panel a and 2.3 Å in panel b. Water beads are not shown for clarity. Periodic boundary conditions apply. Initially the proteins were embedded as far as possible from each other. In panel b, the h3(t5)2 bilayer contains 40 mol% cholesterol. ΔT = 0.28.