
Figure 3.
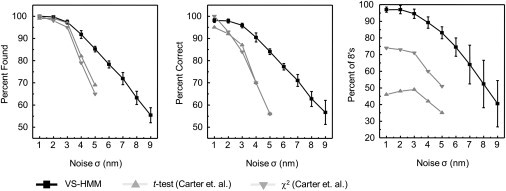
Further evaluation of the VSI-HMM-Viterbi reconstruction (▪) of a simulated stepping time-course. These data are compared with the results of simulations using χ2(▾), and t-test (▴) detectors with optimized filters as reported by Carter et al. (1). The three metrics of Carter et al. (1) are shown: panel A plots the fraction of actual steps that are detected (that is, the fraction of true positives); panel B plots the fraction of the detected steps that correspond to actual ones (that is, unity minus the fraction of false positives); and panel C shows the percentage of 8 nm (±3 nm) steps in the population of true positive events. The task assigned to each step detection method was to interpret simulations having 200 steps of size 8 nm and mean dwell time of 24 points. This was repeated multiple times for each value of added Gaussian noise. Error bars on the HMM data are standard deviations of the respective results from 20 different simulations. Data for the t-test and χ2 are taken from Fig. 5 of Carter et al. (1). The HMM algorithm performs better than the other methods in all three metrics, in particular when noise is large.