
Figure 7.
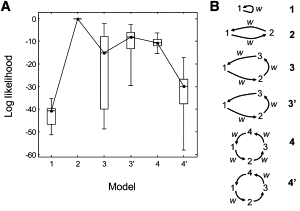
Using likelihood ratios to find the best model for a molecular motor trajectory. (A) Employing 20 different simulations having the same parameters as in Fig. 1D, the maximum log-likelihood is compared for six test models shown in panel B. The Bayes information criterion (24) penalty s = (k/2)ln T has been subtracted from each L value. Here k is the number of parameters (k = 2, 4, 6, 5, 8, and 6 is assumed for models 1–4′, respectively) and T = 500 is the number of data points. Values of L have been shifted so that the value for model 2 is zero. In this box plot the median is plotted, with boxes representing the 25 and 75 percentiles of the distribution of values, and whiskers the extreme values. (B) Models 1–4 involve n = 1–4 molecular states. In these models, each molecular transition is allowed to be accompanied by a position step. In contrast, the 3′ model includes three states but one transition is constrained not to produce a step. Similarly, the 4′ model is composed of four states with every alternate transition not producing a step. In the diagram, w indicates a nonzero step.