
Figure 5.
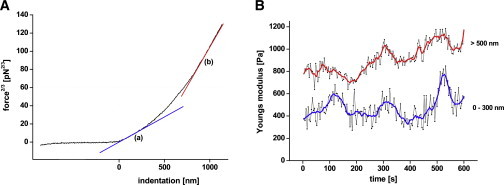
Dependency of the elasticity from the indentation depth. (A) Force at the power 2/3 versus indentation curve. Line a represents elasticity below 300 nm and line b indicates elasticity measured at an indentation above 500 nm. (B) Comparison of elasticities calculated from indentations below 300 nm and above 500 nm from the same dataset. Adjacent-averaging with a 20-points window were shown for indentations of <300 nm and >500 nm.