
Figure 4.
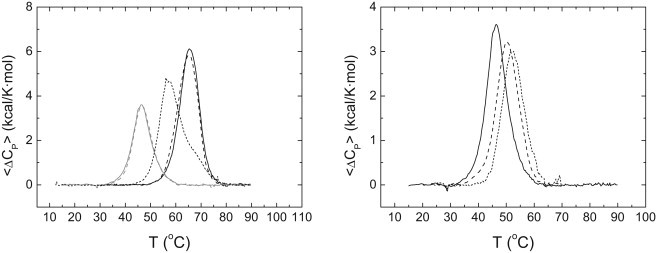
(Left) Thermal denaturation scans of NS3 protease followed by DSC in acetate buffer 100 mM, pH 5. Excess molar heat capacity is represented as a function of temperature. Protein concentration was 40 μM, and zinc concentration was: 90 μM total zinc concentration (black continuous line); 90 μM total zinc concentration and 5 mM total sodium chloride (black dashed line); 1 mM total zinc concentration (black dotted line); 5 mM total zinc concentration (gray continuous line); and 5 mM total zinc (chloride) concentration (gray dashed line). (Right) Thermal denaturation scans of NS3 protease followed by DSC in acetate buffer 100 mM, pH 5. Excess molar heat capacity is represented as a function of temperature. Total zinc concentration was 5 mM, and protein concentration: 40 μM (continuous line), 30 μM (dashed line), and 10 μM (dotted line).