
Figure 2.
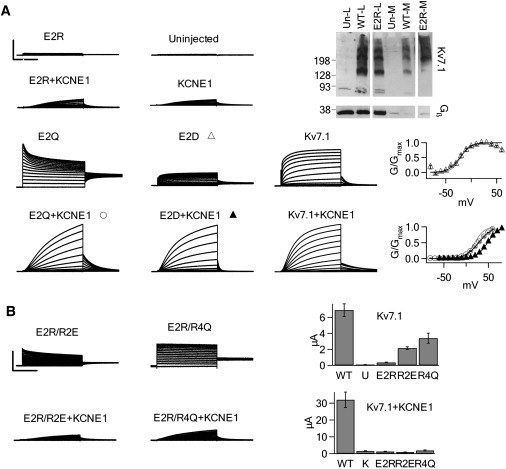
KCNE1 changes electrostatic interactions between E2 with S4. (A) Left: Currents generated from E2R, E2Q, E2D, WT, and endogenous channels. E2R does not express currents beyond the background oocyte currents. Except for E2D+KCNE1, currents were elicited by depolarization from −80 to 60 mV. E2D+KCNE1 was depolarized from −60 to +80 mV. Scale: E2R 4 μA, E2R+KCNE1 4 μA, uninjected 4 μA, KCNE1 4 μA, E2Q 5 μA, E2Q+KCNE1 7 μA, E2D 4 μA, E2D+KCNE1 7 μA, Kv7.1 4 μA, Kv7.1+KCNE1 20 μA; 2 s for all. Top right: Western blot probing for Kv7.1 and Gβ in the whole cell lysate and biotinylated membrane fraction from oocytes. Gβ is a cytoplasmic protein. E2R is expressed on the membrane. Middle right: G-V relationship of E2D relative to WT Kv7.1 (gray line). G-V of E2D is superimposed on WT Kv7.1. Bottom right: G-V relationship of E2Q+KCNE1 and E2D+KCNE1 relative to WT Kv7.1+KCNE1 (gray line). KCNE1 restores voltage dependence to E2Q. (B) Left: Currents from S4 mutations to Glu paired with E2R without (top) and with (bottom) KCNE1 in response to depolarized voltages from −80 mV to +60 mV. Scale: 4 μA; 2 s. Right: Peak current amplitudes at +60 mV were averaged for each mutant. R2E and R4Q restore current to E2R in the absence of KCNE1 but not in the presence of KCNE1. In the bar graph, U indicates currents from uninjected oocytes, and K indicates currents from oocytes injected with KCNE1 only.