
Figure 3.
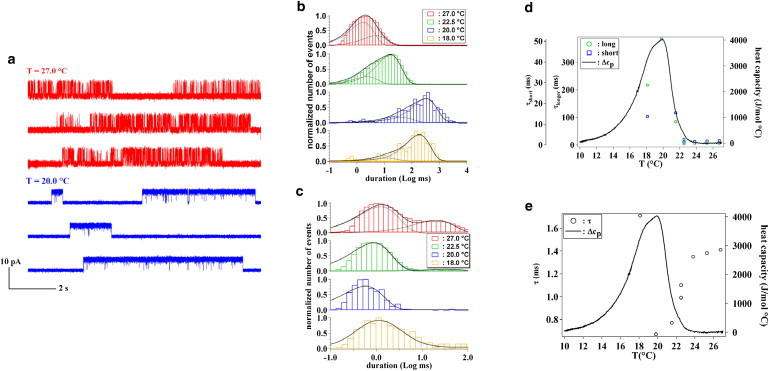
KcsA dwell times as a function of temperature at a holding potential of 50mV. (a) Examples of ion current traces at temperatures of 27.0°C and 22.0°C in a POPE/POPG 3:1 lipid mixture. Channels are open for longer times at the temperature of 20.0°C where the ion conductance presents a maximum. (b and c) Dwell-time histograms for the open (b) and closed (c) states, for KcsA reconstituted into planar bilayers of POPE/POPG 3:1. The open dwell-time and closed dwell-time distributions were fitted with exponential components (…..) resulting in the overall fit (—). (d) Variation of the characteristic open (longer time, ○; slower time, □) and (e) closed times (○) with temperature compared to the downscan DSC trace at pH 3 (—, shifted by −1.5°C) of the corresponding lipid bilayer mixture. Open times show the same trend as the specific heat capacity. Closed times present a minimum at the temperature corresponding to the maximum of the excess heat capacity and open times.