
Figure 1.
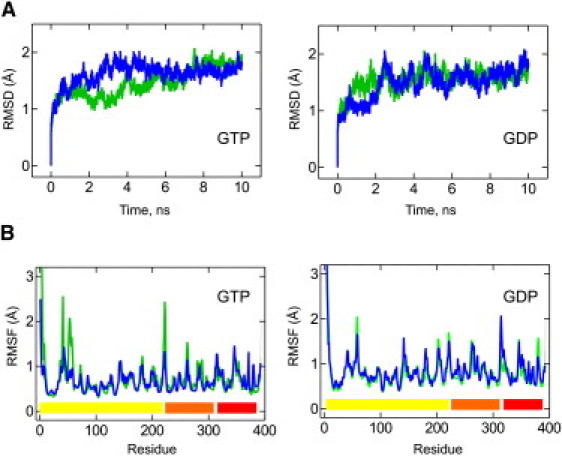
Conformational changes during MD simulation. (A) RMSDs of EF-Tu WT (green) and EF-Tu D109A (blue) from the starting conformation for the GTP and GDP conformations at 300 K. RMSDs were calculated using all backbone atoms and excluded the mobile N-terminus. (B) Cα RMSF for EF-Tu WT (green) and D109A (blue) in the GTP and GDP conformations. Colored bars at the bottom indicate the domain structure of the protein (domains 1–3 in yellow, orange, and red, respectively).