
Figure 2.
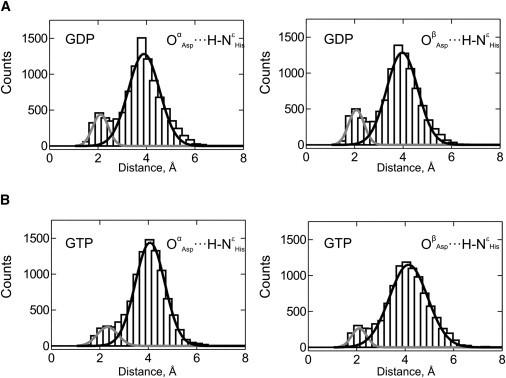
H-bonding between Asp109 and His22. Distances between the two terminal oxygen atoms (Oα and Oβ) of the Asp109 residue and the hydrogen at the Nɛ of His21 were measured during the second half of MD simulations (ns 5–10) for the EF-Tu•GDP and EF-Tu•GTP complexes and plotted as bars. Distances are shown for the Oα and Oβ oxygen atoms of the aspartate side chain in the GDP (A) and GTP (B) complexes. The superimposed Gaussian fits indicate the contribution of the H-bonded (gray) and non-bonded (black) states.