
Figure 4.
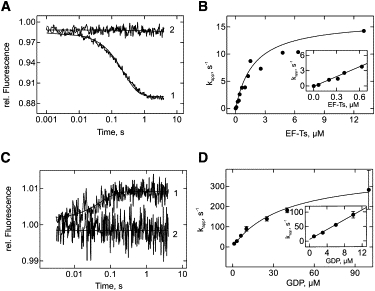
Interaction of EF-Tu D109A with EF-Ts and GDP. (A) Time courses of dissociation of EF-Tu•mant-GDP (0.15 μM) in the presence of EF-Ts (0.2 μM) and excess unlabeled GDP (25 μM, line 1), and in the absence of EF-Ts (line 2). The fluorescence of the mant group was monitored. (B) Concentration dependence of kapp on EF-Tu•mant-GDP dissociation. The kapp-values were calculated by single-exponential fitting of the time courses in A. (C) Time courses of the dissociation of EF-Tu•EF-Ts (0.5 μM) in the presence of GDP (1 μM, line 1) or absence of GDP (line 2), as monitored by the fluorescence of Trp184 in EF-Tu. (D) Concentration dependence of kapp for EF-Tu•EF-Ts dissociation in the presence of GDP. The kapp-values were calculated by single-exponential fitting of the time courses in C.