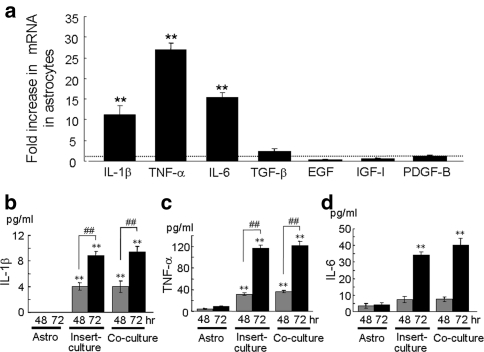
Fig. 3.
Expression of mRNA and release of cytokines and growth factors from activated astrocytes. (a) Quantitative RT–PCR of IL-1β, IL-6, TNF-α, transforming growth factor-β (TGF-β), insulin-like growth factor-1 (IGF-1), epidermal growth factor (EGF), and platelet-derived growth factor-B (PDGF-B) in astrocytes insert-cultured with HARA-B cells. The expression level of each cytokine or growth factor mRNA was normalized to the level of each cytokine in astrocytes cultured alone. The relative values of each cytokine mRNA in insert-cultured astrocytes for 72 h are shown. Each value represents the mean ± SEM (n = 3). Release of IL-1β (b), TNF-α (c) and IL-6 (d) into the culture medium of single-culture of astrocytes (Astro), insert-culture or co-culture of astrocytes and HARA-B cells for 48 and 72 h were detected by ELISA. Each value represents the mean ± SEM (n = 6). ** P < 0.01, ## P < 0.01

