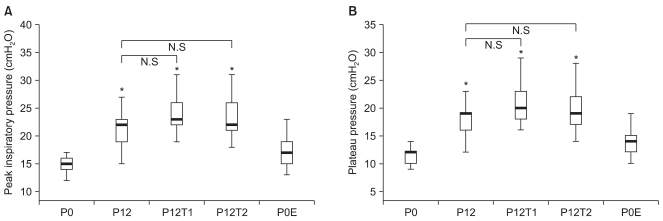
Fig. 1.
Comparison of peak inspiratory (A) and plateau pressure (B) at P0, P12, P12T1, P12T2, P0E. Box and whisker plot showing median, 25th and 75th percentile, T = 10th to 90th percentile. P0: 10 minutes after induction in the supine position, P12: 10 minutes after pneumoperitoneum at 12 mmHg in the supine lithotomy position, P12T1: 10 minutes after pneumoperitoneum at 12 mmHg and 20° head-down position, P12T2: 30 minutes after pneumoperitoneum at 12 mmHg and 20° head-down position, P0E: 10 minutes after deflation in the supine position, N.S: no significance, P > 0.05 compared with P12. *P < 0.05 compared with P0.

