
Figure 3.
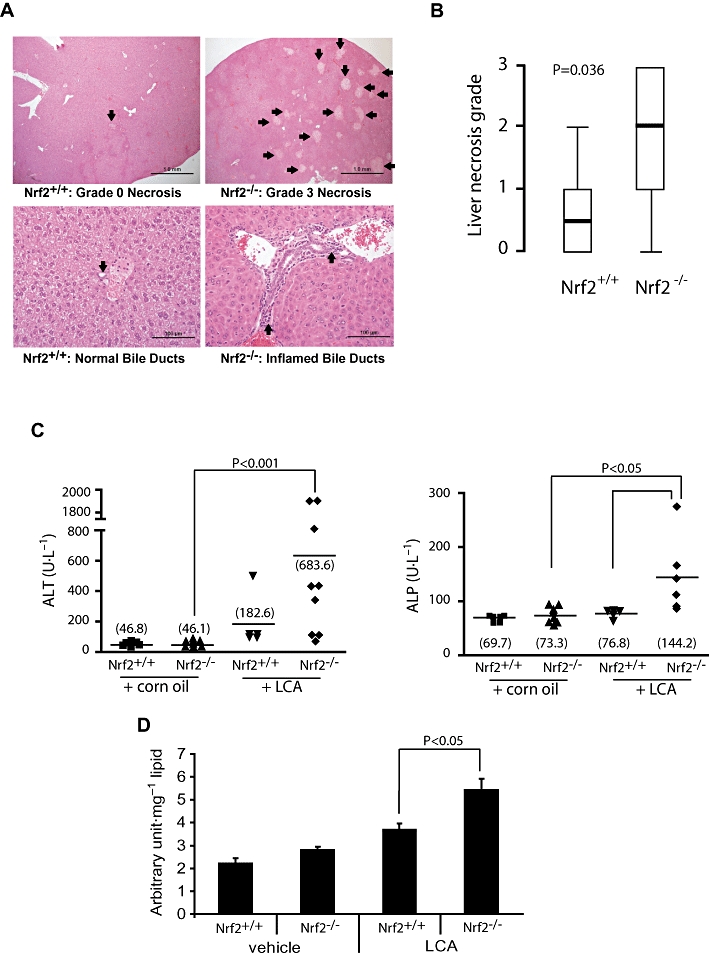
Heightened sensitivity of Nrf2−/− mice to LCA-induced liver injury. (A) Representative haematoxylin and eosin-stained liver sections from LCA-treated mice (125 mg·kg−1 body wt. twice daily for 4 days). Upper panel shows liver histology with arrows pointing to necrotic foci. Arrows on the lower panel shows representative bile ducts. (B) Comparison of liver necrosis grade between the Nrf2+/+ (n = 8) and Nrf2−/− mice (n = 10). Values are shown as box-and-whisker plots with median (thick horizontal bar), inter-quartile ranges (box) and extreme values (whisker). Non-parametric comparison was applied using the Mann–Whitney U-test. (C) Serum ALT and serum ALP (right) of mice treated for 4 days with LCA or vehicle corn oil. The group means are shown as horizontal bars with the actual values in parentheses. Statistical analysis was by the Mann–Whitney U-test. (D) Analysis of hepatic lipid hydroperoxide levels in corn oil- (vehicle) and LCA- (4 day treatment, see above) treated mice. Data shown are means ± SEM; Student's independent t-test was used for statistical comparisons. ALP, alkaline phosphatase; ALT, alanine transferase; LCA, lithocholic acid; Nrf2, nuclear factor (erythroid 2-related) factor 2.