Figure 1.

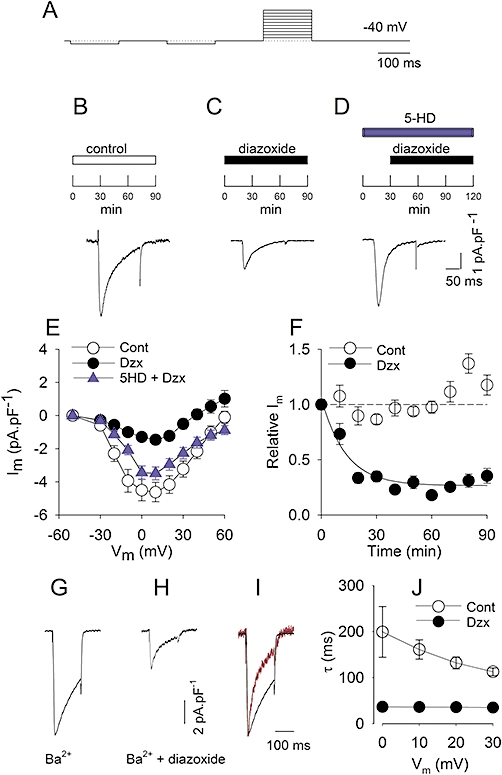
PPC reduces L-type currents. A, pulse protocol. B–D, experimental protocol and representative recordings of L-type Ca2+ currents at 0 mV. B, representative L-type Ca2+ current after 90 min in control solution. C, myocyte after 90 min in diazoxide (100 µM). D, myocyte preincubated for 30 min in 5-HD (100 µM), then 90 min in 5-HD plus diazoxide (100 µM). E and subsequent panels show mean ± SE. E, I-V relationship of peak L-type currents. At the indicated potentials, peak currents are shown from controls (Cont; n = 38); from diazoxide-incubated myocytes (Dzx; n = 29) and from 5-HD plus diazoxide pretreated myocytes (Dzx + 5HD; n = 14). Differences between diazoxide only and control data sets were statistically significant between −20 mV and +30 mV, and at +50 mV (P < 0.05). F: relationship between incubation time and peak L-type Ca2+ currents (○): peak L-type currents as a function of time in control solution (n = 15–38). Corresponding mean values from diazoxide-treated myocytes (n = 10–14); data were significantly different from control data for t >10 min. Dotted line: mean amplitude of control L-type Ca2+ currents at t = 0. Solid line: best fit of a single exponential for diazoxide-treated myocytes with τ= 13.2 min. G, representative recording of L-type Ba2+ currents at 0 mV after 90 min in control solution. H, myocyte after 90 min in diazoxide (100 µM). I, normalized recordings from G (black) and H (red). J, relationship between the time constant of inactivation of L-type Ba2+ currents and voltage under control (Cont) conditions and after diazoxide (Dzx). Values were significantly different at all potentials (n = 4–8).
