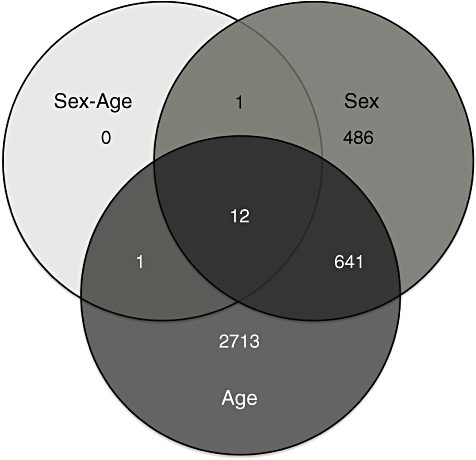
Figure 1.

Venn diagram showing the distribution of gene transcripts that have significant differential expression with respect to age, sex and/or a sex-age interaction. A total of 3367 gene transcripts displayed significant differential expression with age; however, only 2713 transcripts did not show any significant effects with respect to sex or sex-age interaction.
