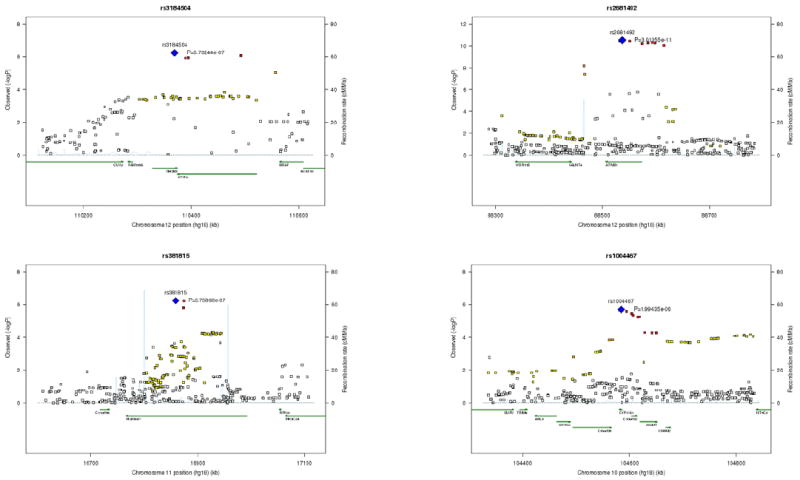
Figure 1. Locus-specific association maps for systolic blood pressure.

Locus-specific (-log10p-values) maps in the CHARGE meta-analysis of systolic blood pressure for four loci with genome-wide significance in the joint analysis of CHARGE with Global BPgen. The four loci are represented by rs3184504 (SH2B3), rs2681492 (ATP2B1), rs381815 (PLEKHA7), and rs1004467 (CYP17A1). For each locus the sentinel SNP (lowest p value) is depicted in blue, SNPs in red have r2 ≥0.8 with the sentinel SNP; SNPs in orange have r2 ≥0.5; those in yellow have r2 ≥0.2; those in white have r2 < 0.2 with the sentinel SNP. Superimposed on the plot are gene locations (green) and recombination rates (blue).
