
Figure 5.
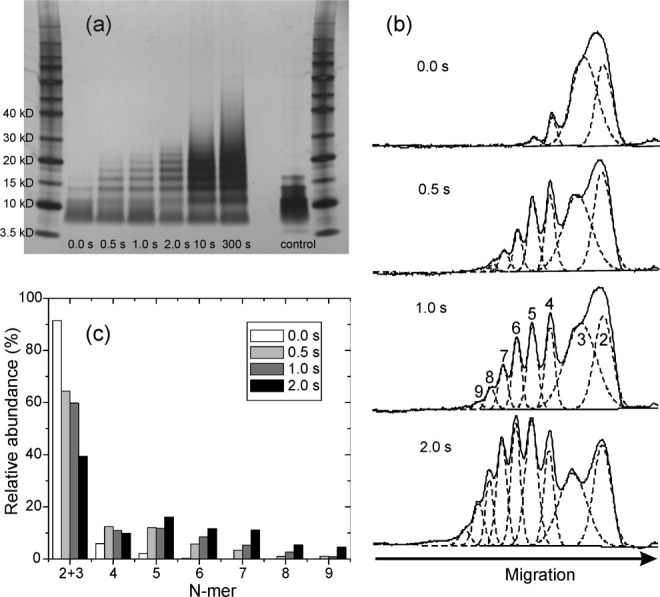
SDS-PAGE analysis of PICUP reaction products after the indicated reaction times, for wild-type Vpu1–40. (a) Scanned image of the gel, with molecular weight markers in the far left and far right lanes. The control lane is purified Vpu1–40 directly dissolved in the gel loading buffer at 50 μM peptide concentration, without exposure to bilayers or crosslinking reagents. (b) Densitometry profiles for lanes 2–5, with fits to Gaussian peaks (dashed lines) that represent the indicated N-mers. (c) Apparent relative abundances of N-mers, determined from the fits in panel (b).