
Figure 7.
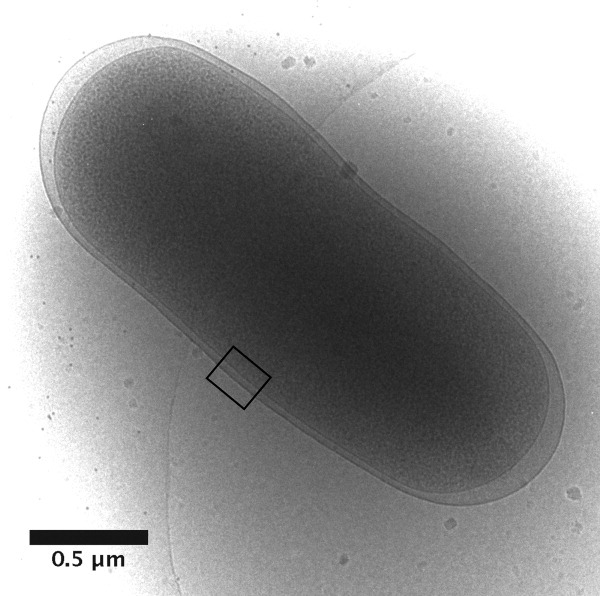
Determination of periplasmic dimensions using cryo-electron microscopy. E. coli K-12 cells in logarithmic phase were plunged into liquid ethane and imaged by cryo-electron microscopy. Shown is a representative whole, frozen-hydrated cell with an inset box indicating the region of interest. The average distance between the inner and outer membranes at the mid-length of 31 such cells was 25.5 ± 3.1 nm. The periplasmic distance increases at the poles as shown in this example.