
Figure 1.
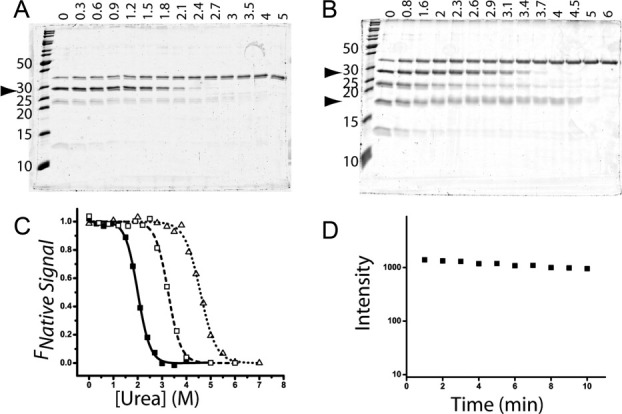
Pulse proteolysis denaturation experiments analyzed on 15% SDS polyacrylamide gels for (A) TEM-1 and (B) TEM-1 with BLIP. Urea concentrations are listed above each lane, and molecular weights for ladder proteins are listed to the left of each gel, with an arrow pointing at the proteins of interest (TEM-1, 29 kDa or BLIP, 17 kDa). The remaining bands are due to thermolysin (35 kDa) and its autolysis products (23 and 12 kDa). (C) Denaturation curves for TEM-1 (solid squares), TEM-1 with BLIP (open squares), or BLIP (open triangles) fitted to a Boltzmann sigmoid to determine the inflection point, 2.00M and 4.49M urea for TEM-1 and BLIP, respectively. (D) Varying the pulse length from 1–10 min at a urea concentration equal to the Cm has little effect on native TEM-1.