Abstract
Spatially and temporally programmed expression of the Hox genes along the antero-posterior (A-P) axis is essential for correct pattern formation during embryonic development. An accumulating body of evidence indicates the pivotal role of spatial chromatin organization for the coordination of gene regulation. Recently, chromosome conformation capture (3C) technique has been developed and opened a new way to study chromosomal interactions in the nucleus. In this study, we describe 3C method we applied in F9 embryonic teratocarcinoma cells and demonstrate that the chromosomal interactions at Hox loci are successfully detected. Interestingly, at Hoxc loci, the abundance of intrachromosomal interactions with neighboring fragments was drastically decreased when the genes are expressed. These results indicate the possibility of the dynamic pattern of chromosomal interaction in association with the transcriptional regulation of Hox genes.
Keywords: Hox genes, chromosome conformation capture, spatial organization, chromosomal interaction, gene expression
Introduction
Regulation of transcriptional activation in higher eukaryotes involves long-range genomic interactions (Carter et al., 2002; Dekker 2008; Kleinjan et al., 2008). In many cases regulatory elements are located at large genomic distances from target genes, or even on different chromosomes. Several studies have recently confirmed that distant elements function by engaging in direct physical interactions with their target genes (Tolhuis et al., 2002; Lomvardas et al., 2006; Chavanas et al., 2008; Boney-Montoya et al., 2010). The chromosome conformation capture (3C) method has provided an opportunity to map these interaction networks.
3C method uses formaldehyde crosslinking to covalently link interacting chromatin segments in intact cells (Dekker et al., 2002). Crosslinked chromatin is then digested with an appropriate restriction enzyme. The digestion is followed by ligation under diluted DNA concentration, which promotes intra-molecular ligation of cross-linked fragments. Each ligation product reflects an interaction between two genomic loci and can be analyzed and quantified by PCR.
Hox genes are master regulators of development and play pivotal roles during adult tissue differentiation (Wang et al., 2009). In mammals, there are 39 Hox genes organized into 4 genomic clusters of 13 paralogue groups. During development, the expression of Hox genes is regulated both spatially and temporally in an order correlating with the location of the genes from 3' to 5' in the clusters (Izpisúa-Belmonte et al., 1991; Gaunt et al., 1996). This colinearity strongly suggests that chromatin structure plays an important role in their regulation. For the study of collinear Hox gene expression in response to retinoic acid, mouse or human derived embryonic carcinoma (EC) cells has been used (Stornaiuolo et al., 1990; Boncinelli et al., 1991). Differential activation of certain specific Hox genes in murine F9 teratocarcinoma stem cells has been reported since 1980s (Breier et al., 1986; Murphy et al.,1988). Upon RA treatment, however, comprehensive sequential analysis of whole Hox gene expression patterns along the cluster has not been reported yet.
In this study, we examined RA-induced Hox gene expression pattern in F9 cells and employed 3C to analyze spatial organization at Hox loci to better understand how chromosome conformation changes upon Hox gene activation.
Materials and Methods
Cell culture
Murine F9 teratocarcinoma cells were cultured in Dulbecco's Modified Eagles Medium (WelGENE Inc., Daegu, Korea) supplemented with 10% FBS (Fetal bovine serum; WelGENE Inc., Daegu, Korea) and 100 ug/ml penicillin-streptomycin (WelGENE Inc., Daegu, Korea), at 37℃, 5% CO2 condition. The cells were induced to differentiate by addition of 5×10⁻⁷ M retinoic acid (RA) to the medium. After the RA treatment, the cells were harvested everyday starting at Day 1 until Day 4. The cells with no treatment were harvested and used as controls.
Total RNA isolation and gene expression analysis using RT-PCR
Total RNAs were isolated from RA-treated or untreated F9 cells using RNA-bee reagent (Tel-Test, Inc., Friendswood, TX, USA). Reverse transcription (RT) was performed with 2 ug of the RNA and cDNA was generated by using the ImProm-llTM Reverse Transcriptase (Promega, Madison, WI, USA). PCR amplification was performed under the following conditions: initial denaturation for 2 min at 94℃, followed by 30 cycles of 94℃ for 40 sec, 58℃ for 30 sec and 72℃ for 1 min. PCR was repeated with three different set of samples. All PCR primers used for detecting Hox gene expression levels were described previously (Yu et al., 2009). For quantification, Multi Gauge V3.0 software (Fuji, Tokyo, Japan) was used.
Chromosome conformation capture (3C)
The 3C assay was performed as described previously (Dekker et al., 2002) with minor modification. In brief, single cells harvested from indicated conditions were crosslinked with formaldehyde and the DNA-protein complex was digested with HindIII, which was followed by ligation at diluted DNA concentration. For each set of experiment, RA-treated (Day 1 and Day 3) or untreated F9 cells (approximately 1×10⁸ cells) were harvested and filtered through a cell-strainer (40 mM, SPL #93040; SPL lifesciences, Pocheon, Korea) to obtain a homogeneous single cell suspension. Formaldehyde (37%; Biosesang, Seongnam, Korea) was added to 1%, and the samples were crosslinked for 10 min at room temperature. The reaction was quenched by the addition of glycine to 0.125 M. The cells were harvested, washed with PBS and lysed in 5 ml of ice-cold lysis buffer (10 mM Tris-Cl [pH 8.0], 10 mM NaCl, 0.2% NP-40 [pH 8.0]) containing complete protease inhibitors (Roche, Indianapolis, IN, USA). Isolated nuclei were washed with appropriate restriction buffer and resuspended in same buffer (0.5 mL per 1×10⁷ cells) containing 0.3% SDS and incubated for 1 hr at 37℃ while shaking. Triton X-100 was added to 1.8%, and the nuclei were further incubated for 1 hr at 37℃ to sequester the SDS. The crosslinked DNA was digested overnight with the restriction enzyme Hindlll (400 U per 1×10⁷ cells; TAKARA, Otsu, Shiga, Japan). An aliquot of DNA was collected before and after the digestion to determine the digestion efficiency. The restriction enzyme was inactivated by the addition of SDS to 1.6% and incubation at 65℃ for 20 min. The reaction was diluted with ligase buffer (50 mM Tris-Cl [pH 7.5], 10 mM MgCl2, 10 mM DTT, 1 mM ATP), Triton X-100 was added to 1% and incubated for 1 hr at 37℃. The DNA was ligated using T4 ligase (8,000 cohesive-end units; TAKARA) for 4 hr at 16℃ followed by 30 min at room temperature. Proteinase K was added, and samples were incubated overnight at 65℃ to reverse the crosslinks. The following day, samples were incubated for 30 min at 37℃ with 30 µL of RNase A (10 mg/mL), and the DNA was purified by phenol extraction and ethanol precipitation. The resulting template represents a library of all possible ligation products, which are then detected by PCR. Each experimental set was prepared in triplicate. The DNA concentration was carefully determined using a Nanodrop spectrophotometer. Mouse BAC clones carrying Hoxa and Hoxc cluter genes (RP23-39E6 and RP24-459N19, respectively, CHORI BACPAC, Oakland, CA, USA) were used as 3C control templates. Two microgams of the BAC DNA was digested with HindIII and religated so that a collection of all possible ligation products are present in equinolar amounts.
PCR analysis of the 3C templates
To determine the digestion efficiency of each 3C template, an aliquot of undigested and digested samples was decrosslinked, and DNA was isolated using phenol/chloroform extraction followed by ethanol precipitation. For assessing the digestion efficiency, 150 ng of DNA was used as a template. PCR was performed by using hTaq polymerase (Solgent, Seoul, Korea) under the following conditions: initial denaturation for 3 min at 95℃, and then 27 cycles of 95℃ for 40 sec, 58℃ for 20 sec and 72℃ for 30 sec. We introduced a touchdown PCR method for detection of genomic band from combination of aP and cP series of primers. PCR cycle consisted of initial denaturing at 95℃ for 3 min, 10 cycles of touchdown PCR wherein the beginning annealing temperature of 65℃ was decreased 0.5℃ per cycle for 10 cycles with extension at 72℃ for 30 sec, denaturation at 95℃ for 1 min, and the following 40 cycles were at 95℃ for 1 min, 60℃ for 20 sec and 72℃ for 30 sec. The resulting PCR products were analyzed by conventional agarose gel electrophoresis.
Results
Sequential Hox gene expression in RA-treated F9 cells
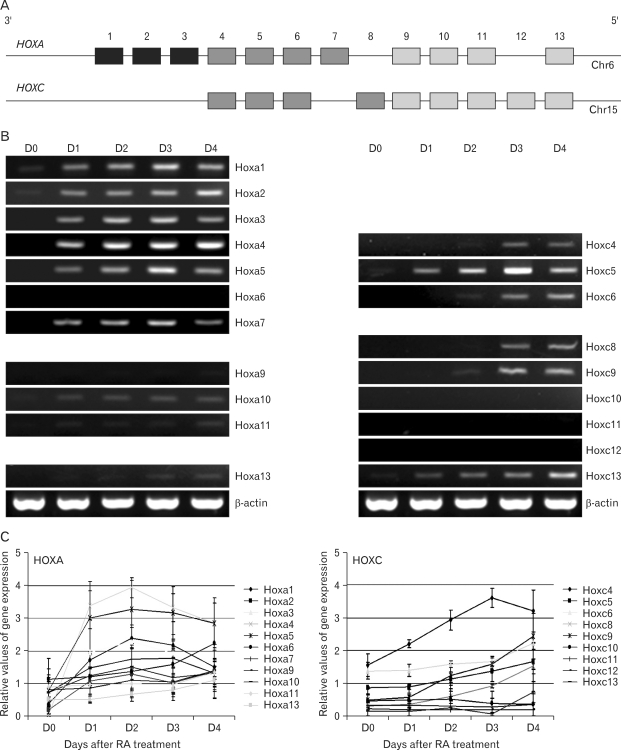
We first examined here the expression profile of Hox genes following RA treatment. To investigate the expression patterns of Hox genes located in Hoxa and Hoxc cluster, F9 cells were treated with 5×10⁻⁷ M RA for 4 days. None of Hox genes showed an expression detectable in untreated F9 cells. Whereas Hoxa cluster genes, especially Hoxa1 to Hoxa7 genes which are located at the 3' region of their loci, are rapidly induced by 24 hr treatment with RA. Hoxa9 to Hoxa13 genes, near the 5' end of the Hoxa cluster are only slightly induced after 3 days of RA treatment. Notably, most Hoxc cluster genes are lately induced at Day 3 and Day 4 after RA treatment (Fig. 1). These results demonstrate that the addition of RA to growing F9 cells induce Hox gene expression with gene-specific kinetics, especially Hoxa cluster gene was induced earlier than Hoxc genes. In Hoxa cluster, the phenomenon of spatial collinear expression, such that more 3' located genes are activated first, whereas more 5' located genes are expressed later, was partially actualized in current conditions.
Fig. 1.
Expression pattern of Hoxa and Hoxc cluster genes following RA treatment. (A) Hoxa and Hoxc gene organization in each cluster. (B) F9 cells were cultured with RA for 4 days. Total RNAs were isolated each day from Day 1 to Day 4 (D0: control cells with no RA treatment), and then RT-PCR was performed with each Hox primers. β-actin was used as a positive control for amplifiable cDNA. Data are representative of one of three replicate experiments. (C) The relative expression level of each Hox gene was determined by using Multi Gauge software. The amount of each RT-PCR product was normalized with that of β-actin to obtain relative intensities. Each point represents the average of three separate experiments. Error bars represent SEM.
Quality control of 3C templates by PCR
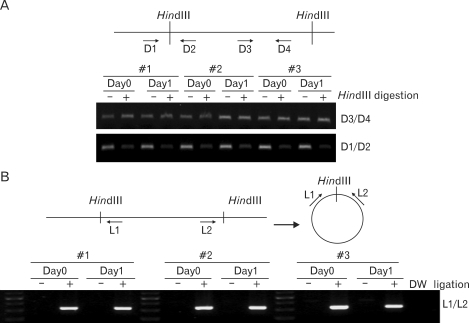
To determine whether chromatin conformation change is coupled with the gene expression in Hox cluster, we applied 3C method and analyzed physical contacts between DNA segments within Hox loci. First of all, the efficiencies of digestion and ligations were examined to validate whether the 3C templates reliably detect the chromosome conformation changes. The efficiency of digestion was tested by comparing PCR product from the primers D1/D2 annealing to the region spanning a restriction enzyme site of HindIII and the product from the primers D3/D4 annealing to the region lacking restriction enzyme recognition site within the amplified fragment (Fig. 2A). The result showed that the restriction enzyme digested all different set of templates with similar efficiencies. The efficiency of self ligation was examined by PCR using primers L1/L2. As shown in Fig. 2B, the PCR bands were detected only in ligated samples. Our PCR analysis also proved there was no preference for any particular region both in digestion and ligation.
Fig. 2.
PCR analysis of restriction digestion and ligation efficiency used for the evaluation of 3C template (A) To determine digestion efficiency, primer pairs D1/D2 and D3/D4 were used. When the HindIII restriction digestion was completed, D1/D2 primer pair gives a faint PCR band whereas D3/D4 primers generate a band whether DNA templates are undigested (-) and digested (+) with HindIII. (B) To determine the efficiency of self ligation, the primer L1/L2 was used. DNA was prepared before (-) and after (+) the ligation step. The 3C templates from Day 3 of RA treatment were also tested with same ways and obtained similar results (Data not shown).
Dynamic Hoxc chromatin architecture upon gene expression
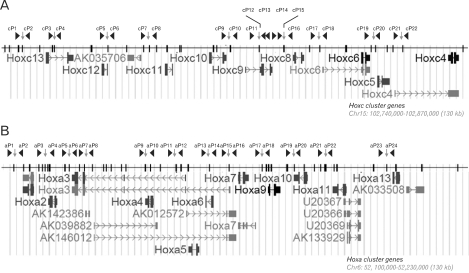
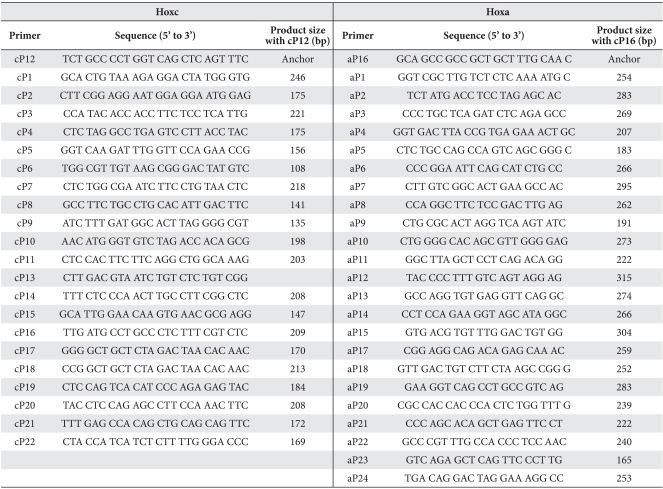
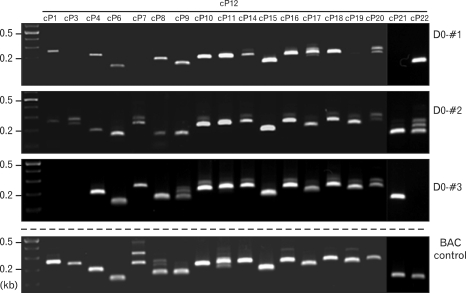
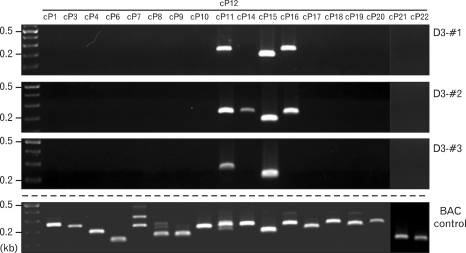
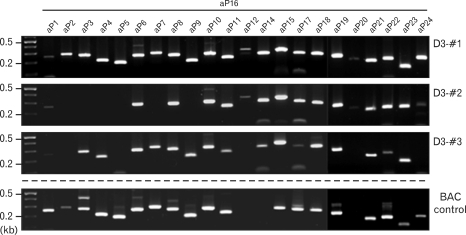
To determine whether the activation of gene expression is accompanied by chromosome conformational changes, we performed 3C analysis in Hox loci. The positions of primers used in 3C-PCR are presented in Fig. 3. All of the primers were designed at a site that is ~50 to ~200 bp from the HindIII recognition site. The primers P12 in Hoxc cluster (cP12) and P16 in Hoxa cluster (aP16) were used as an anchor to perform PCRs together with other test primers in each locus. Primer sequences and the predicted size with anchor primers are listed in Table 1. Each primer was tested with BAC DNA containing whole Hoxa or Hoxc cluster genes after HindIII digestion and random ligation. With the combination of cP12 and test primers residing in Hoxc loci, many PCR products were generated from a large number of primer pairs in untreated D0 samples (Fig. 4). 3C-PCR was performed with replicates from each condition and comparable results were obtained, although the reproducibility for long-range interactions was worse than the short-range ones. Interestingly, these all possible interactions, except few (such as cP11, cP14-16), were undetectable in RA-treated Day 3 samples (Fig. 5), when most of Hoxc cluster genes are overall induced (Fig. 1). Pointed out the fact that the bands that were detected in Day 3 samples are originated from self-ligated or uncut DNA, we conclude that intrachromosomal interactions in Hoxc loci at Day 3 of RA treatment are quite rare. PCR bands from BAC control template ensured all possible ligation and similar efficiency of amplification from each primer pair (Fig. 4, 5). Unquestionably, the quality of Day 3 sample was validated by doing PCR with primer pairs for Hoxa loci (Fig. 6). Hoxa loci, in contrast to Hoxc loci, revealed similar interaction profiles in both untreated and RA-treated Day 1 samples (data not shown), implying that chromosome conformation at Hoxa loci was constant regardless of Hoxa gene induction. These results suggest that the spatial organization of the Hoxc loci, but not of the Hoxa loci, is dynamically changed, which was accompanied by Hoxc gene expression by RA.
Fig. 3.
Schematic presentation of the Hoxc (A) and Hoxa (B) loci showing the primer as well as HindIII regcognition sites. The UCSC Genes track includes both protein-coding and putative non-coding transcripts. The black bar depicts the HindIII recognition sites. The position of each primer we used for 3C analysis is indicated as arrowhead along with a serial number (cP1-cP22 and aP1-aP24 in Hoxc and Hoxa clusters, respectively). Each Hoxc and Hoxa region we analyzed covers 130 kb in mouse chromosome 15 and 6, respectively.
Table 1.
Primers used in 3C PCR
Fig. 4.
Identification of intrachromosomal interaction of RA-untreated (D0) samples at Hoxc loci. 3C-PCR was performed with the primers indicated. The primer cP12 was used as an anchor. 3C DNA templates of 250 ng were used per each PCR. This experiment was performed three times (D0-#1, D0-#2, D0-#3) for validation of this method.
Fig. 5.
Identification of intrachromosomal interaction of RA-treated (D3) samples at Hoxc loci. 3C-PCR was performed with the primers indicated. The primer cP12 was used as an anchor. 3C DNA templates of 250 ng were used per each PCR. This experiment was performed three times (D3-#1, D3-#2, D3-#3) for validation. Compare to those of Fig. 4, many PCR bands were disappeared indicating the disappearance of intrachromosomal interaction.
Fig. 6.
Identification of intrachromosomal interaction of RA-treated (D3) samples at Hoxa loci. 3C-PCR was performed with the primers indicated. The primer aP16 was used as an anchor. 3C DNA templates of 250 ng were used per each PCR. This experiment was performed three times (D3-#1, D3-#2, D3-#3) for validation.
Discussion
The establishment and maintenance of differential gene expression pattern of Hox gene is of fundamental importance during development or adult tissue maintenance. Recently there has been a great deal of interest in analyzing physical contacts between control DNA elements and target genes as an attempt to explain how spatial chromatin organization is critical in highly regulated gene expression. Considering the fact that appropriate spatial and temporal regulation of gene expression is actualized by the combined action of multiple regulatory elements which are dispersed throughout large genomic regions, the finding and characterization of the genomic elements which tune differential gene transcription through physical interactions with the target genes will provide new insight into a three-dimensional view of cell regulatory network. The present study reinforces the notion that the genome's spatial organization has great potential for gene regulation.
3C technique potentially allows identification of physical interactions between any chromatin segments. Therefore, it has been successfully applied to demonstrate long-range interactions, for example between transcriptional regulatory elements and distal target genes (Tolhuis et al., 2002; Murrell et al., 2004; Spilianakis et al., 2004). In this study, we have generated 3C templates and proved their quality by comparing PCR products in two important steps of analysis, that is, restriction endonuclease digestion and ligation, between normal experiments with mock controls (un-digested/un-ligated samples). Together with the results for the quality control, reproducible detection of chromosomal interactions in three independently cross-linked samples was good signs to prove the validity of our samples. Although we were unable to detect interchromosomal interactions between Hoxc and Hoxa loci with the defined testing primers we used in this experiment (Data not shown), we cannot exclude a possibility of interchromosomal interactions occurred in other regions where we did not tested here.
Our 3C results showing abundant intrachromosomal interactions at Hoxc loci in RA-untreated samples, but not in Day 3 of RA-treated samples, implies that the compact chromatin structure was formed at Hoxc loci when the genes are transcriptionally inactive so that they interact frequently with neighboring fragments. Perhaps the chromatin would have turned into loose to facilitate transcription process at Day 3 after RA treatment, resulting in less interaction among DNA within Hoxc loci. Previous studies on the genome-wide scanning of Hoxb1-associated loci in mouse ES cells using 3C-based technique demonstrated that the proportion of interchromosomal interactions between Hoxb1 and the rest of the genome increased after its induction, while interactions with distal intra-chromosomal loci become less frequent (Würtele et al., 2006). These results were compatible with FISH data showing decondensation and repositioning of Hoxb1 outside of its chromosome territory during its expression (Chambeyron et al., 2004). In addition, a study using THP-1 human myelomonocytic cell lines demonstrated that the repression of Hoxa9, 10, 11 and 13 expression during cell differentiation is associated with the formation of distinct contacts between the genes and with an overall increase in chromatin packaging (Fraser et al., 2009). Taken together with the results of previous studies, the current findings on dynamic chromatin organization at Hoxc loci strongly suggest that spatial organization of Hox loci plays a role in gene regulation.
Acknowledgements
Ms. H. Min is a graduate student supported by BK21 (Brain Korea 21) scholarship. This work was supported by grants from R01-2008-000-10549-0 (2008-0058561) and 2009-0070964 from NRF, and partly by 20070401-034-030 from the BioGreen21 Program, RDA, Korea.
References
- 1.Boncinelli E, Simeone A, Acampora D, Mavilio F. HOX gene activation by retinoic acid. Trends Genet. 1991;7:329–334. doi: 10.1016/0168-9525(91)90423-n. [DOI] [PubMed] [Google Scholar]
- 2.Boney-Montoya J, Ziegler YS, Curtis CD, Montoya JA, Nardulli AM. Long-Range transcriptional control of progesterone receptor gene expression. Mol Endocrinol. 2010;24:346–358. doi: 10.1210/me.2009-0429. [DOI] [PMC free article] [PubMed] [Google Scholar]
- 3.Breier G, Bućan M, Francke U, Colberg-Poley AM, Gruss P. Sequential expression of murine homeo box genes during F9 EC cell differentiation. EMBO J. 1986;5:2209–2215. doi: 10.1002/j.1460-2075.1986.tb04486.x. [DOI] [PMC free article] [PubMed] [Google Scholar]
- 4.Carter D, Chakalova L, Osborne CS, Dai YF, Fraser P. Long-range chromatin regulatory interactions in vivo. Nat Genet. 2002;32:623–626. doi: 10.1038/ng1051. [DOI] [PubMed] [Google Scholar]
- 5.Chambeyron S, Bickmore WA. Chromatin decondensation and nuclear reorganization of the HoxB locus upon induction of transcription. Genes Dev. 2004;18:1119–1130. doi: 10.1101/gad.292104. [DOI] [PMC free article] [PubMed] [Google Scholar]
- 6.Chavanas S, Adoue V, Mechin MC, et al. Long-range enhancer associated with chromatin looping allows AP-1 regulation of the peptidylarginine deiminase 3 gene in differentiated keratinocyte. PLoS ONE. 2008;3:e3408. doi: 10.1371/journal.pone.0003408. [DOI] [PMC free article] [PubMed] [Google Scholar]
- 7.Dekker J. Ggene regulation in the third dimension. Science. 2008;319:1793–1794. doi: 10.1126/science.1152850. [DOI] [PMC free article] [PubMed] [Google Scholar]
- 8.Dekker J, Rippe K, Dekker M, Kleckner N. Capturing chromosome conformation. Science. 2002;295:1306–1311. doi: 10.1126/science.1067799. [DOI] [PubMed] [Google Scholar]
- 9.Fraser J, Rousseau M, Shenker S, et al. Chromatin conformation signatures of cellular differentiation. Genome Biology. 2009;10:R37. doi: 10.1186/gb-2009-10-4-r37. [DOI] [PMC free article] [PubMed] [Google Scholar]
- 10.Gaunt SJ, Strachan L. Temporal colinearity in expression of anterior hox genes in developing chick embryos. Dev Dyn. 1996;207:270–280. doi: 10.1002/(SICI)1097-0177(199611)207:3<270::AID-AJA4>3.0.CO;2-E. [DOI] [PubMed] [Google Scholar]
- 11.Izpisúa-Belmonte JC, Falkenstein H, Dollé P, Renucci A, Duboule D. Murine genes related to the Drosophila AbdB homeotic genes are sequentially expressed during development of the posterior part of the body. EMBO J. 1991;10:2279–2289. doi: 10.1002/j.1460-2075.1991.tb07764.x. [DOI] [PMC free article] [PubMed] [Google Scholar]
- 12.Kleinjan DA, Lettice LA, Veronica van H, Robert EH. Chapter 13 long range gene control and genetic disease. Advances in genetics, academic press. 2008;Volume 61:339–388. doi: 10.1016/S0065-2660(07)00013-2. [DOI] [PubMed] [Google Scholar]
- 13.Lomvardas S, Barnea G, Pisapia DJ, Mendelsohn M, Kirkland J, Axel R. Interchromosomal interactions and olfactory receptor choice. Cell. 2006;126:403–413. doi: 10.1016/j.cell.2006.06.035. [DOI] [PubMed] [Google Scholar]
- 14.Murphy SP, Garbern J, Odenwald WF, Lazzarini RA, Linney E. Differential expression of the homeobox gene Hox-1.3 in F9 embryonal carcinoma cells. Proc Natl Acad Sci USA. 1988;85:5587–5591. doi: 10.1073/pnas.85.15.5587. [DOI] [PMC free article] [PubMed] [Google Scholar]
- 15.Murrell A, Heeson S, Reik W. Interaction between differentially methylated regions partitions the imprinted genes Igf2 and H19 into parent-specific chromatin loops. Nat Genet. 2004;36:889–893. doi: 10.1038/ng1402. [DOI] [PubMed] [Google Scholar]
- 16.Spilianakis CG, Flavell RA. Long-range intrachromosomal interactions in the T helper type 2 cytokine locus. Nat Immunol. 2004;5:1017–1027. doi: 10.1038/ni1115. [DOI] [PubMed] [Google Scholar]
- 17.Stornaiuolo A, Acampora D, Pannese M, et al. Human HOX genes are differentially activated by retinoic acid in embryonal carcinoma cells according to their position within the four loci. Cell Differ Dev. 1990;31:119–127. doi: 10.1016/0922-3371(90)90015-o. [DOI] [PubMed] [Google Scholar]
- 18.Tolhuis B, Palstra R-J, Splinter E, Grosveld F, de Laat W. Looping and interaction between hypersensitive sites in the active beta-globin locus. Mol Cell. 2002;10:1453–1465. doi: 10.1016/s1097-2765(02)00781-5. [DOI] [PubMed] [Google Scholar]
- 19.Wang KC, Helms JA, Chang HY. Regeneration, repair and remembering identity: the three Rs of Hox gene expression. Trends Cell Biol. 2009;19:268–275. doi: 10.1016/j.tcb.2009.03.007. [DOI] [PMC free article] [PubMed] [Google Scholar]
- 20.Würtele H, Chartrand P. Genome-wide scanning of HoxB1-associated loci in mouse ES cells using an open-ended chromosome conformation capture methodology. Chromosome Res. 2006;14:477–495. doi: 10.1007/s10577-006-1075-0. [DOI] [PubMed] [Google Scholar]
- 21.Yu SJ, Lee JY, Kim SH, Deocaris CC, Kim MH. Synthetic maternal stress hormone can modulate the expression of Hox genes. J Exp Biomed Sci. 2009;15:249–255. [Google Scholar]


