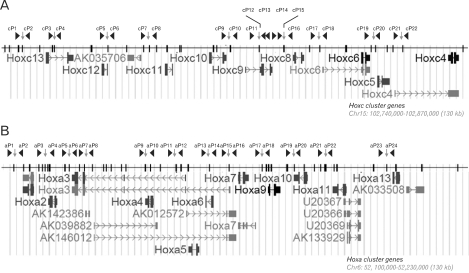
Fig. 3.
Schematic presentation of the Hoxc (A) and Hoxa (B) loci showing the primer as well as HindIII regcognition sites. The UCSC Genes track includes both protein-coding and putative non-coding transcripts. The black bar depicts the HindIII recognition sites. The position of each primer we used for 3C analysis is indicated as arrowhead along with a serial number (cP1-cP22 and aP1-aP24 in Hoxc and Hoxa clusters, respectively). Each Hoxc and Hoxa region we analyzed covers 130 kb in mouse chromosome 15 and 6, respectively.

